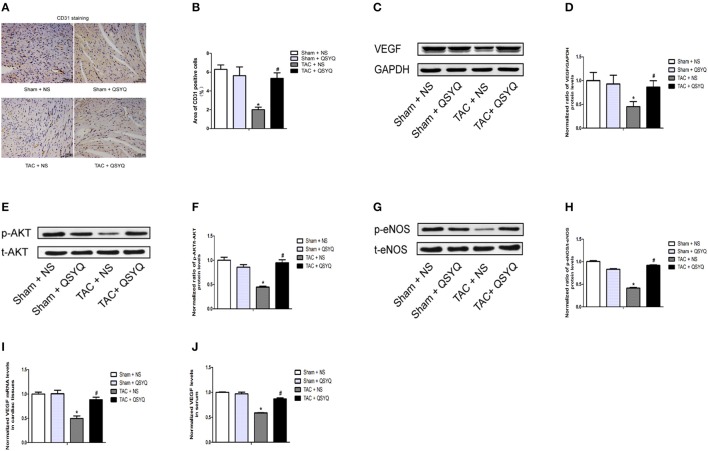
Figure 5.
QSYQ alleviated cardiac microvessel impairment in TAC mice. (A) Representative photographs of sections of left ventricles with immunohistochemical staining with anti-CD31 antibody (scale bar, 100 μm). (B) Quantitation of CD31 expression level in the heart (*P < 0.05 vs. Sham + NS group; #P < 0.05 vs. TAC + NS group); data shown are means ± SEM (n ≥ 4 per group). (C) Representative immunoblots for VEGF in the heart. (D) Quantitative analysis of cardiac expression of VEGF measured by western blot. (E) Representative immunoblots for t-Akt (total-Akt) and p-Akt (phospho-Akt) in the heart. (F) Quantitative analysis of cardiac expression of t-Akt and p-Akt measured by western blot. (G) Representative immunoblots for t-eNOS (total-eNOS) and p-eNOS (phospho-eNOS) in the heart. (H) Quantitative analysis of cardiac expression of t-eNOS and p-eNOS measured by western blot. (I) Quantitation of VEGF expression level in the heart measured by real-time PCR. (J) Quantitation of VEGF expression level in plasma measured by elisa. The p-Akt to t-Akt ratio and p-eNOS to t-eNOS ratio indicated, respectively, the levels of Akt and eNOS phosphorylation in the heart. *P < 0.05 vs. Sham + NS group; #P < 0.05 vs. TAC + NS group; data shown are means ± SEM (n = 3 per group).

