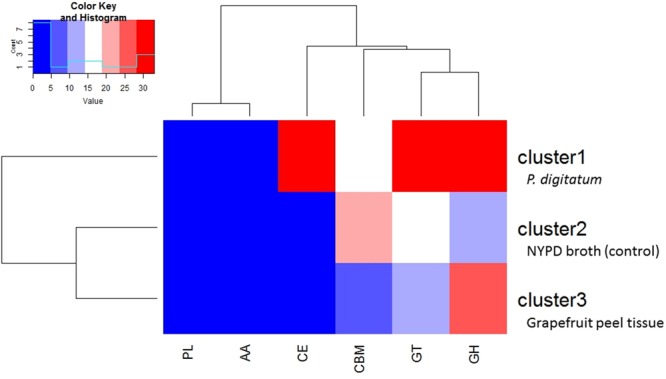
FIGURE 5.

Diagram showing the relative number of genes within each class of CAZymesin each cluster. Cluster1 genes were more highly expressed, relative to cells grown in NYPD broth (control) or on grapefruit peel tissue, when the yeast cells were in contact with Penicillium digitatum (Pd) mycelium. Cluster 2 genes were more highly expressed in Mf grown in NYPD broth (control). Cluster 3 genes exhibited higher levels of expression when Mf cells were grown in contact with grapefruit peel tissue. Cluster 3 show also the highest quantity of CAZY enzymes. The color reflects the relative number of genes in each of the clusters as indicated by the scale in the upper left portion of the figure. Different classes of CAZYenzyme genes are designated as GH –Glycoside Hydrolases; GT – Glycosyl Transferases; PL – Polysaccharide Lyases; CE – Carbohydrate Esterases; CBM – Carbohydrate-Binding Modules and AA – Auxiliary Activities.
