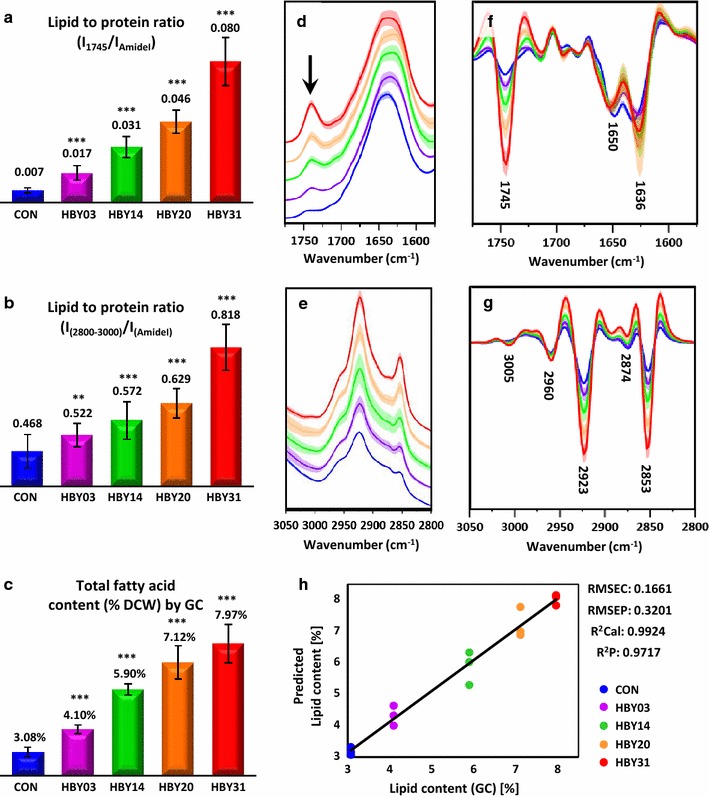
Fig. 1.

Results of the assessment of total fatty acid content obtained via (a, b, d–h) ATR-FTIR and (c) GC for all studies cell lines (CON, HBY03, HBY14, HBY20 and HBY31). (a, b) The ratio of lipid to protein obtained on the basis of ATR-FTIR spectra calculated as the ratio of: a the band at 1745 cm−1 to the amide I band and b the bands in high wavenumber region to the amide I band. c The total fatty acid content obtained for all cell lines through GC. Detailed fatty acid quantification from GC is presented in Additional file 1: Table S1. All bar charts (a–c) show the results obtained together with their standard deviation (SD). d, e Average ATR-FTIR spectra (with SD) of all cell lines and g, h their 2nd derivatives (with SD) used for calculation of ratios presented in (a) and (b) are shown in the range (d, f) 1550–1800 cm−1 and (e, g) 2800–3050 cm−1. Average ATR-FTIR spectra in the whole measured range (3600–600 cm−1) are presented in Additional file 1: Fig. S1, S2. h Results of prediction of the total fatty acid content for the validation set by the PLS regression model (2800–3050 cm−1) on the basis of 2nd derivatives of ATR-FTIR spectra. ***p < 0.01 vs control and **p < 0.05 vs control
