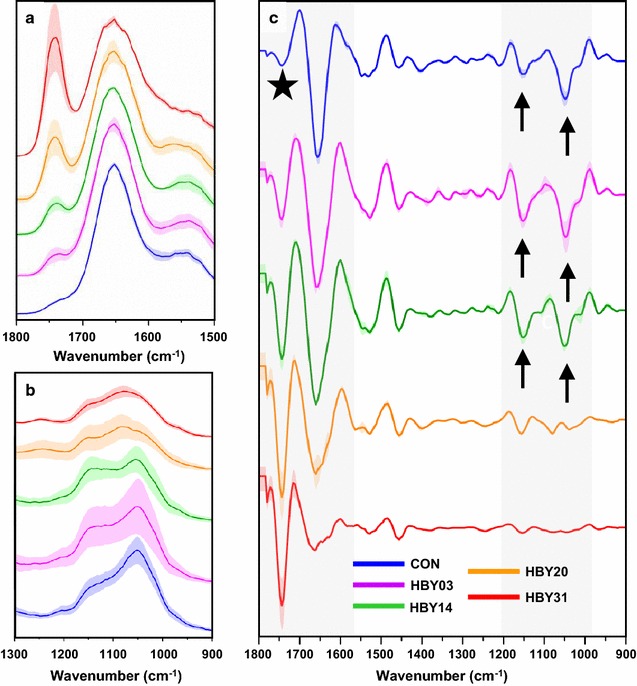
Fig. 8.

Averaged AFM–IR spectra of cytoplasm of engineered yeast cells in the range (a) 1800–1500 cm−1 and (b) 1300–900 cm−1 together with c their 2nd derivative in the range 1800–900 cm−1. Each presented average spectrum was obtained by averaging 30 single spectra collected for different cells (of the same strain) and is shown with SD. Each single spectrum in this study was collected from cytoplasm, after localization of the LB (or confirmation of its absence) through AFM–IR imaging. Grey area, black star and black arrows mark the most prominent differences
