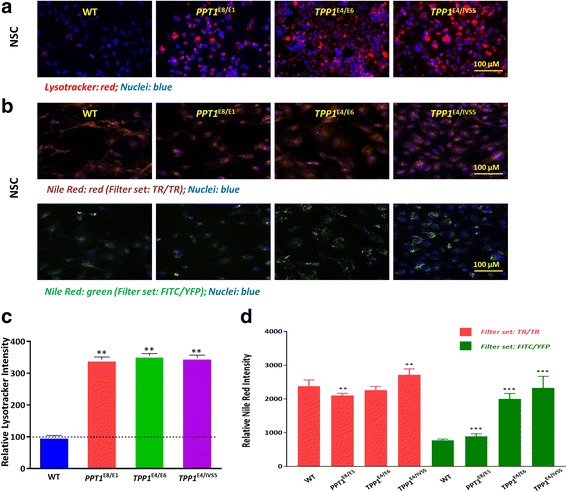
Fig. 1.

Enlarged lysosomes and lipid accumulation in NCL patient NSCs. Increased LysoTracker dye staining (a) indicates enlarged lysosomes and a strong Nile red staining (b) indicates cytoplasmic lipid droplet accumulation in NCL NSCs compared to the WT control cells. Representative image of LysoTracker dye and Nile red staining were shown with 40X objective lens. Quantification of the acidic compartment (c) revealed significantly enlarged lysosomes in NCL NSCs and quantification of the cytoplasmic lipid droplet accumulation (d) was found significantly increased in NCL NSCs. Data are displayed as mean ± SD. ** P < 0.01 vs. WT control
