
Fig. 5.
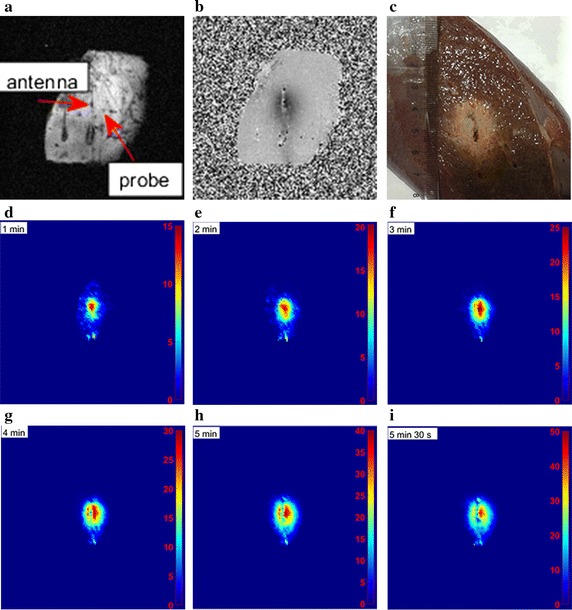
a Magnitude image of ex vivo porcine liver acquired before ablating (red arrows indicated microwave ablation antenna and probe, respectively). b Phase difference image. c Ex vivo porcine liver after microwave ablation. d–i Relative temperature maps for ex vivo porcine liver at six time points during microwave ablation procedure