Figure 3.
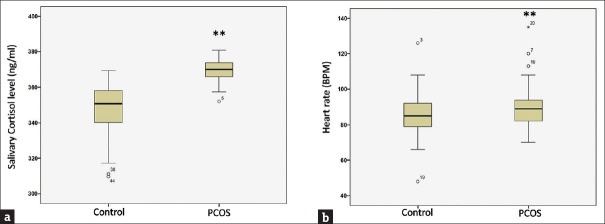
Activation of hypothalamic–pituitary–adrenal axis along with heart rate in polycystic ovarian syndrome patients in comparison to age-matched control (a) salivary cortisol level (b) heart rate. All values in the respective box plots show 25%, 50% (median), and 75% quartile values, and the error bar indicates the standard deviation. **The significant change with respect to control at P < 0.01 level

