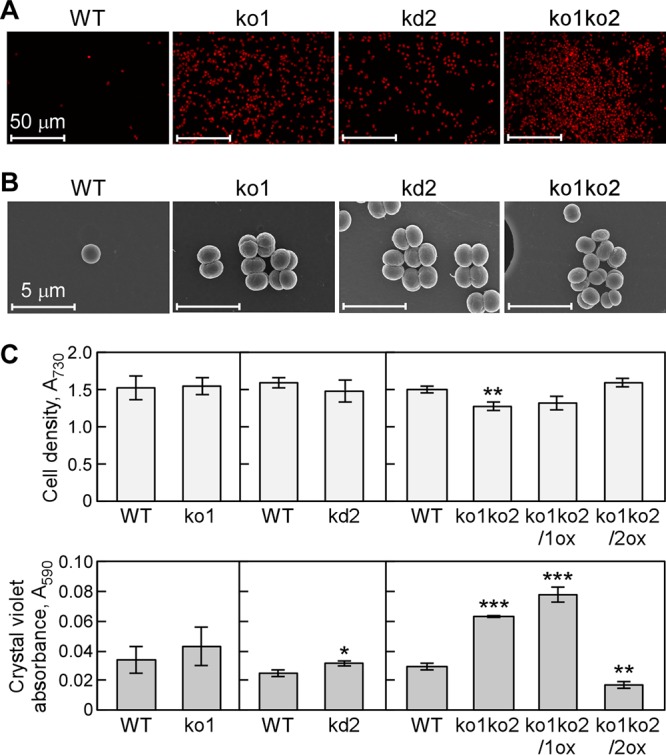
FIG 7.

Effect of inactivation of adc1 and adc2 on growth and biofilm formation in Synechocystis. (A and B) Representative microscopic images obtained by CLSM (A) or FE-SEM (B) show biofilm formation of ko1, kd2, and ko1ko2 strains in medium after 5 days not seen with the wild type. Sample preparation was essentially the same as that described for Fig. 1C and D. The experiments were replicated three times and representative images are shown. (C) Growth curves of Synechocystis wild-type, ko1, kd2, ko1ko2, ko1ko2/1ox, and ko1ko2/2ox strains cultivated in BG11 medium without NaCl addition in 96-well polystyrene plates. (Top) The cell density was measured as the OD730. (Bottom) The amount of cells attached to the walls of the plates was quantified by crystal violet staining as described in the legend to Fig. 1. Each value corresponds to the mean ± SD (n = 3). Significant differences between the wild type (WT) and each mutant were analyzed by Student's t test (*, P < 0.05; **, P < 0.01; ***, P < 0.001).
