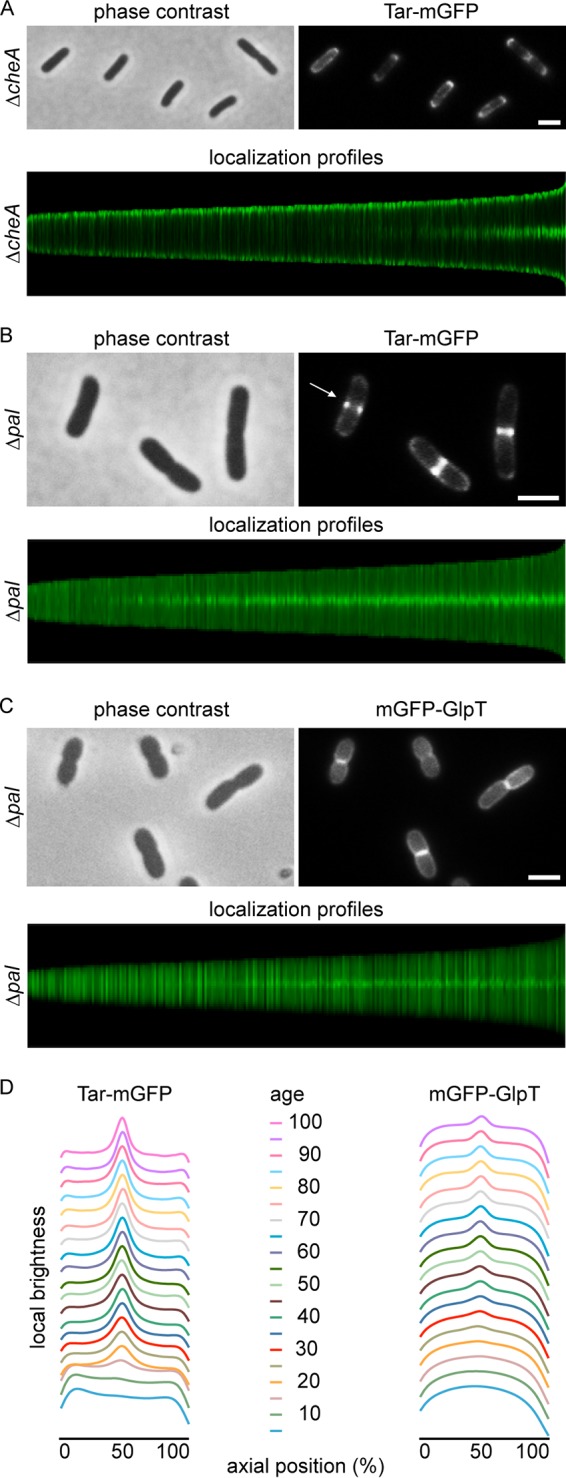
FIG 3.

Effect of cheA and pal deletion mutants on Tar-mGFP localization. (A) Fluorescence microscopy image and localization profile of Tar-mGFP-expressing cheA deletion mutant. A total of 5,948 cells were used to construct the localization profile. (B) Fluorescence microscopy image and localization profile of Tar-mGFP-expressing pal deletion mutant. The arrow indicates Tar-mGFP foci. A total of 9,044 cells were used to construct the localization profile. (C) Fluorescence microscopy image and localization profile of mGFP-GlpT expressed in the pal deletion mutant. A total of 5,214 cells were used to construct the localization profile. (D) Graphical presentation of fluorescence signals during the pal deletion mutant cell cycle, calculated from the localization profiles. Age refers to age classes divided in 5% (cell cycle) bins. Strains used in panels A, B, and C are TSE38, TSE31, and TSE71, respectively. Bars, 2 μm.
