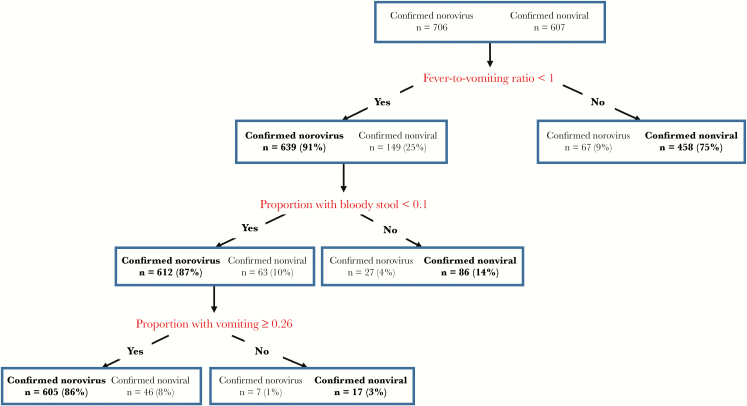
Figure 1.
Classification of outbreaks reported to the National Outbreak Reporting System (NORS) based on classification and regression tree (CART) model-derived characteristics. Characteristics derived from CART modeling distinguish confirmed norovirus outbreaks from confirmed nonviral outbreaks with NORS 2009–2012 data. Starting with 2939 confirmed norovirus and 1573 confirmed nonviral outbreaks, clinical and epidemiologic predictors were assessed. Of the outbreaks with all reported characteristics, 706 confirmed norovirus and 607 confirmed nonviral outbreaks were categorized. Each rectangular partition represents a node, with the number of outbreaks and the outbreak percentage by category (total norovirus and nonviral outbreaks) displayed. Text in boldface represents the category with the most common class of outbreaks in each node. The “fever-to-vomiting ratio” represents the proportion of cases with fever divided by the proportion of cases with vomiting. The “proportion with bloody stool” represents the proportion of cases with bloody stool. The “proportion with diarrhea” represents the proportion of cases with diarrhea. The “proportion with vomiting” represents the proportion of cases with vomiting.

