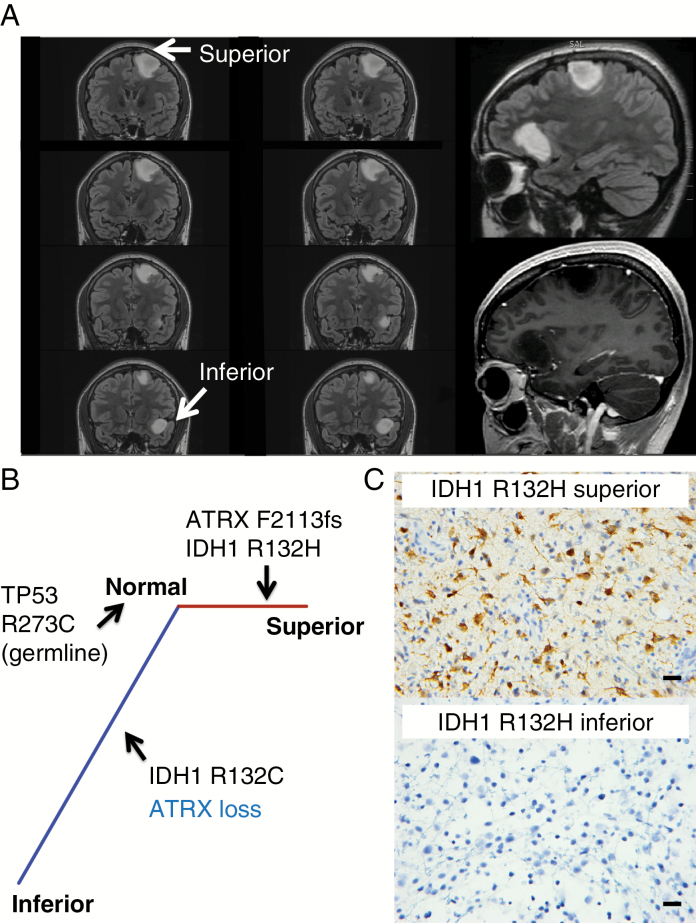
Fig. 2.
Protein expression and phylogenetic analyses among the tumors in Patient 1 revealed mutational heterogeneity in IDH1 and ATRX. (A) This patient had 2 non-enhancing, T2 bright left frontal tumors. The right bottom image shows the resection cavities of the lesions. (B) Phylogenetic tree derived from somatic mutations from exome sequencing. Branch length is proportional to the number of coding single nucleotide somatic mutations. Aberrations identified by IHC are labeled in blue. (C) IHC using IDH1 R132H antibody. Scale bar, 20 μm.

