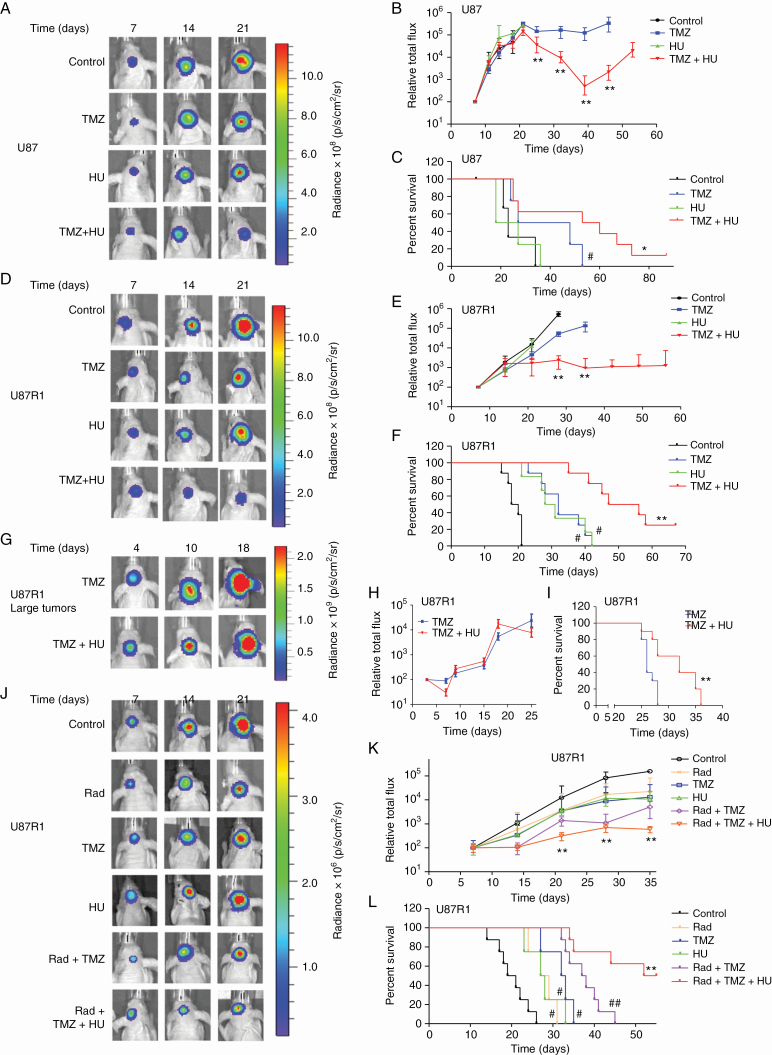
Fig. 2.
HU sensitizes GBM cells to TMZ in vivo. (A–F) Fifty thousand U87 (A–C) or U87R1 (D–F) cells expressing Fluc were implanted in the striatum of athymic mice brains (day 1). One week later, mice were randomized into 4 groups (n = 6–10/group) and treated with either DMSO vehicle, HU (30 mg/kg), TMZ (5 mg/kg for U87 cells and 50 mg/kg for U87R1 cells), or similar doses of TMZ+HU. Tumor growth was monitored over time by Fluc imaging and survival was recorded generating Kaplan–Meier plots. Images of a representative mouse from each group are shown (A and D), tumor-associated bioluminescence signal was quantified (B and E; **P < 0.001, TMZ+HU vs TMZ only), and survival was analyzed; # P < 0.05 vs control, * P < 0.05 (C), ** P < 0.01 (F), TMZ+HU vs TMZ only. (G–I) Two hundred thousand U87R1 cells expressing Fluc were implanted in the brain of nude mice (day 1). Two weeks later, mice were divided into 2 groups (n = 10/group) and treated with either TMZ (50 mg/kg) or TMZ (50 mg/kg) + HU (30 mg/kg) for one week. Tumor volume (P > 0.05) and mice survival (**P = 0.0031) were analyzed. (J–L) U87R1 cells expressing Fluc were implanted in the brain of nude mice (day 1). One week later, mice were divided into 6 groups (n = 10–20/group) and treated with either DMSO vehicle, radiation (R; 3 Gy), HU, TMZ, R+TMZ or R+TMZ+HU. Tumor growth was monitored over time by Fluc imaging (**P < 0.01, R+TMZ+HU vs R+TMZ) and survival was recorded to generate Kaplan–Meier plots (#P < 0.05, ##P < 0.01 vs control, **P < 0.01 R+TMZ+HU vs R+TMZ by log-rank test).

