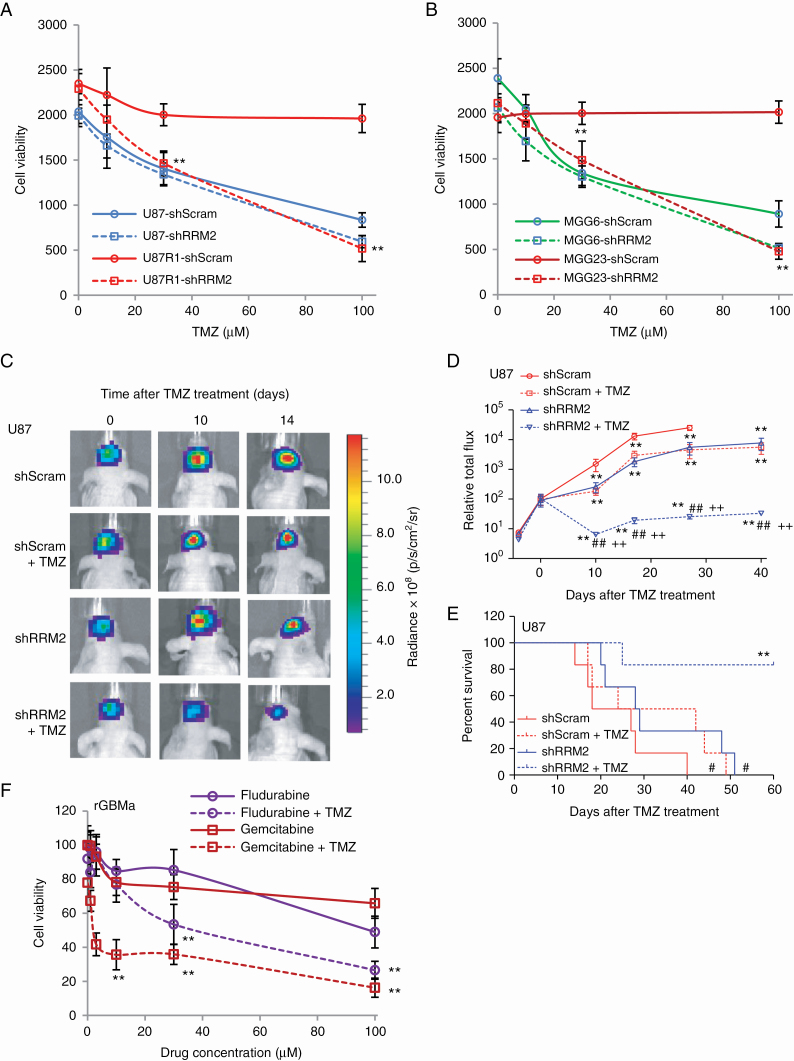
Fig. 5.
Knockdown/inhibition of RNR sensitizes GBM cells to TMZ. (A–B) U87 and TMZ-resistant subline U87R1 (A), TMZ-sensitive MGG6 with methylated MGMT promoter and TMZ-resistant MGG23 with unmethylated MGMT promoter (B) were infected with a lentivirus vector expressing scrambled shRNA (shScram) or shRNA against RRM2 (shRRM2) and treated with different doses (0–100 µM) of TMZ. Cell viability was assessed 4 days later using the Gluc assay. Data presented as Gluc relative light unit (mean ± SD, n = 8; **P < 0.01 shScram vs shRRM2). (C–E) The left forebrains of mice were implanted with 2×10⁴ U87 cells expressing Fluc and either shScram or shRRM2. Each group of mice was divided into 2 subgroups, which received i.p. injection (3 times/wk over 3 wk) of either DMSO or TMZ (30 mg/kg body weight). (C) Fluc imaging was performed once/week to monitor tumor growth. Representative images at 0, 10, and 14 days post-TMZ treatment are shown. (D) Tumor-associated signal is quantified; **P < 0.01 vs shScram+DMSO, ##P < 0.01, shRRM2+TMZ vs shRRM2+DMSO, ++P < 0.01, shRRM2+TMZ vs shScram+TMZ by ANOVA and Tukey’s post-hoc test. (E) Kaplan–Meier plots analyzing mice survival in different groups; #P < 0.05, shScram+TMZ or shRRM2+DMSO vs shScram+DMSO; **P < 0.01 shRRM2+TMZ vs shRRM2+DMSO. (F) rGBMa cells cultured from recurrent GBM tumors were treated with different doses of either gemcitabine or fludarabine in the presence or absence of TMZ (100 μM). Three days later, cell viability was assessed using the Gluc assay; **P < 0.01 gemcitabine+TMZ or fludarabine+TMZ vs gemcitabine or fludarabine only.

