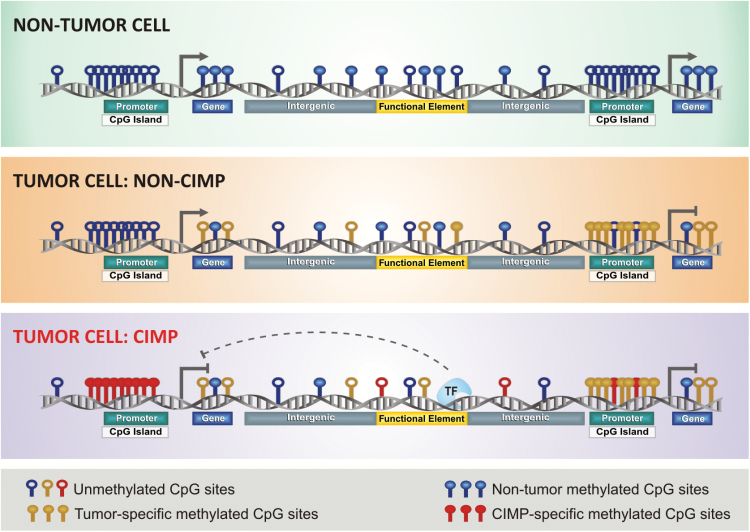
Fig. 1.
CIMP subtypes in human cancer. This illustration depicts aberrant DNA methylation changes at specific genomic loci in normal and tumor cells, especially in CIMP tumors. Each DNA strand represents one individual methylome. Methylated CpG sites in normal state are represented in blue, non-CIMP tumor DNA methylation gain in yellow, and aberrant DNA hypermethylation in CIMP tumors in red (modified from Weisenberger38).

