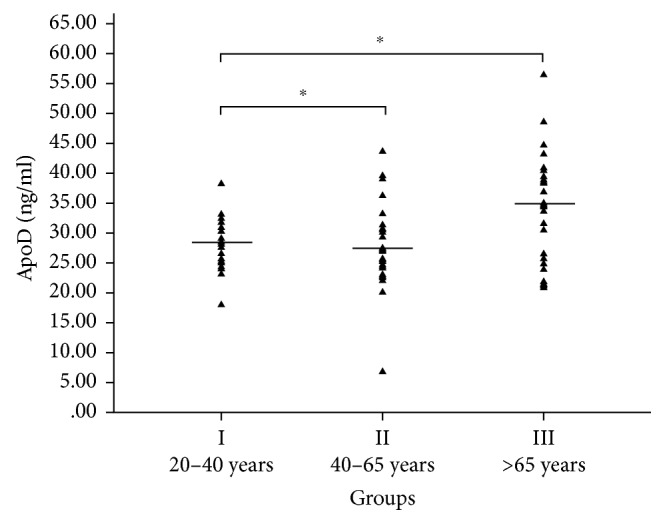
Figure 1.

Age-dependent ApoD concentration in human plasma. Horizontal lines show the average distribution of age-related ApoD concentration in plasma in group I (mean 28.28 ± 4.01 ng/ml, n=30, and 20–40 years), group II (mean 27.73 ± 7.26 ng/ml, n=30, and 40–65 years), and group III (mean 34.61 ± 9.21 ng/ml, n=30, and >65 years). The increase in ApoD concentration was significant in subjects of group III compared to subjects of group I (p < 0.001) and group II (p < 0.002).
