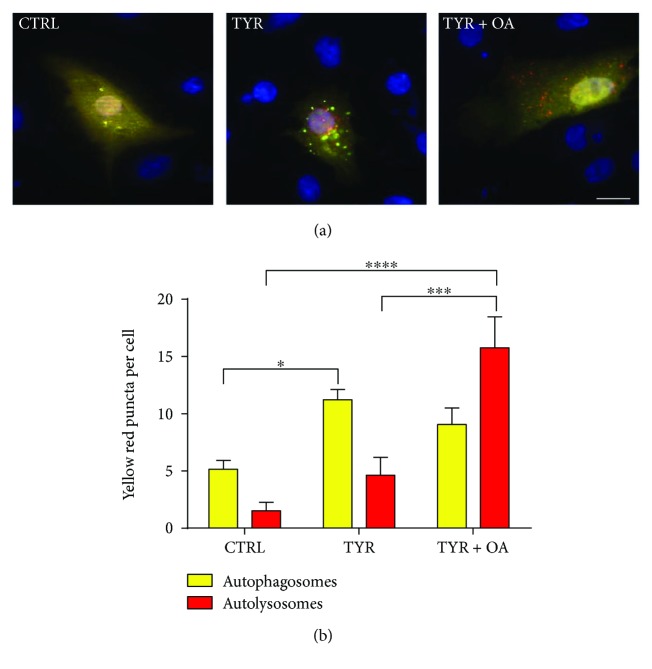
Figure 6.
OA restores autophagic flux in Ad-MAO-A-transduced cardiomyocytes. Double immunofluorescence imaging of RFP-GFP-LC3 in Ad-MAO-A-transduced cardiomyocytes stimulated with TYR (500 μM) for 6 h or with TYR + OA added during the last 4 h (posttreatment). Representative images (upper panel). Scale bar 20 μm. Quantification of yellow puncta (autophagosomes) and red puncta (autolysosomes) for each condition is displayed on the histogram (lower panel) (N = 5 independent experiments; for each experiment, 10 cells were quantified per condition). ∗∗∗∗ p < 0.0001, ∗∗∗ p < 0.001, and ∗ p < 0.05.

