Figure 2.

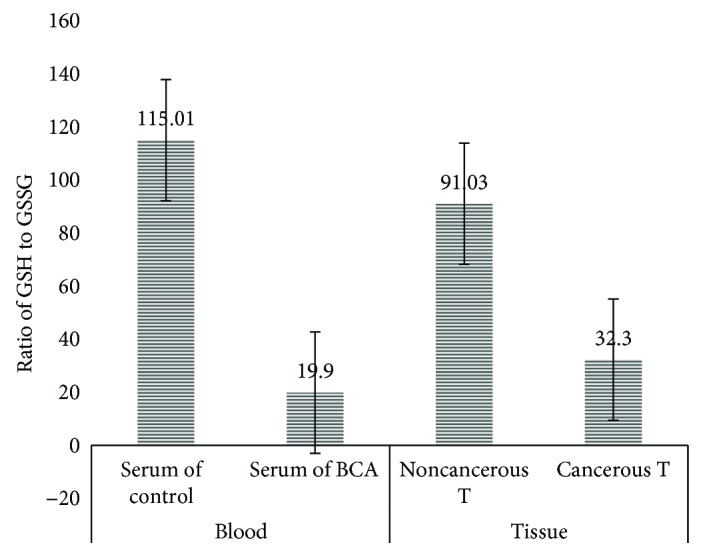
A bar graph showing glutathione index in serum and cancerous tissues of breast cancer (BCA) patients in comparison to serum of control group and noncancerous tissues of breast cancer patients, Addis Ababa, Ethiopia, 2015–2017.

A bar graph showing glutathione index in serum and cancerous tissues of breast cancer (BCA) patients in comparison to serum of control group and noncancerous tissues of breast cancer patients, Addis Ababa, Ethiopia, 2015–2017.