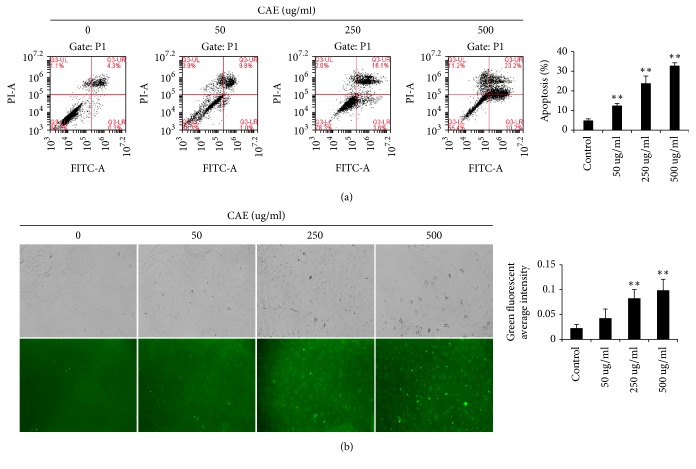
Figure 4.
CAE accelerates pulmonary fibroblast apoptosis: (a) flow cytometry analysis. Cells were treated with or without varying concentrations of CAE (0, 50, 250, and 500 ug/mL). After 48 h, the cells were stained by Annexin V-FITC test kit and analyzed by flow cytometry. Histogram indicated that the apoptosis rate in the CAE group was significantly higher than the control group. For the statistics of each panel in this figure, all data are expressed as mean ± SD (n = 3). ∗∗P < 0.01 versus control. (b) Cells were stained by Annexin V-FITC test kit and observed with a fluorescence microscope. For the statistics of each panel in this figure, all data are expressed as mean ± SD (n = 5). ∗∗P < 0.01 versus control.

