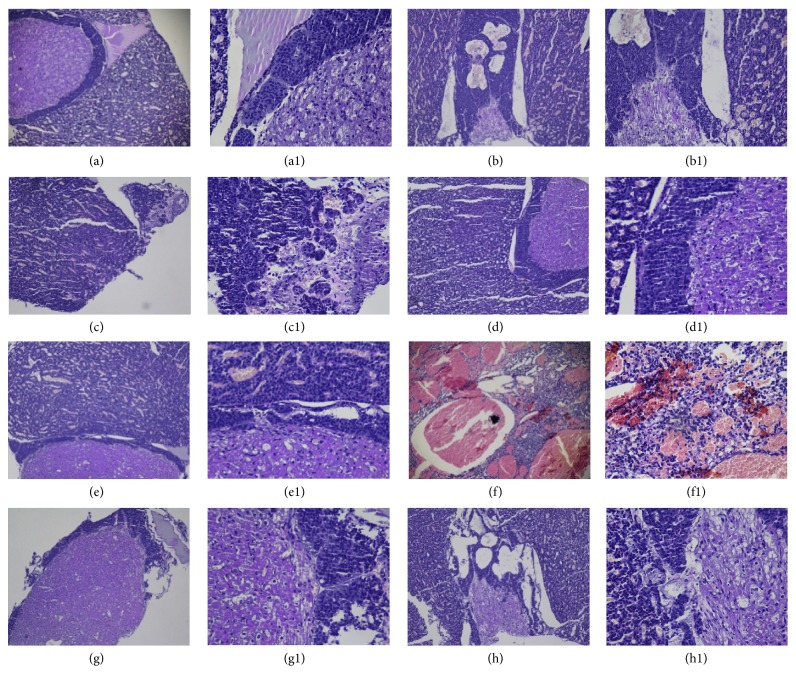
Figure 4.
Histology of pituitaries from each group: all sections were stained with H&E. (a), (a1): control; (b), (b1): POF model group; (c), (c1): group A1; (d), (d1): group A2; (e), (e1): group A3; (f), (f1): group B1; (g), (g1): group B2; (h), (h1): group B3. ((a)–(h)) Magnification: ×100. ((a1)–(h1)) Magnification: ×400.

