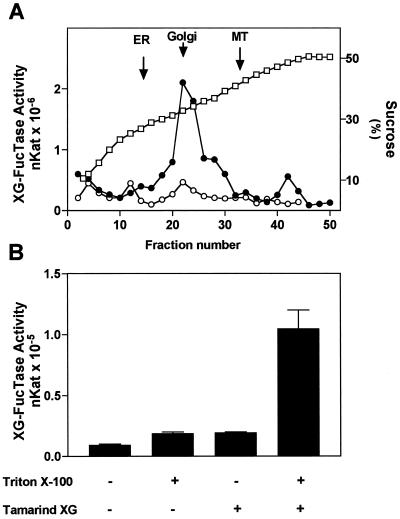
Figure 1.
Subcellular distribution of XG-FucTase activity in pea stems. A, Organelles were separated on a linear Suc gradient (20%–50%) fractionated from the top of the tube. XG-FucTase was measured in the absence (○) and presence (●) of 0.05% (v/v) Triton X-100. Marker enzyme activity for ER (NADPH cytochrome c reductase antymicin A insensitive), Golgi (latent UDPase), and mitochondria (MT) (cytochrome c oxidase) were measured. The peak of the marker enzyme activity is indicated with arrows. The Suc concentration in each fraction is shown (□). A representative experiment is shown, and different experiments gave similar results. B, XG-FucTase was measured for 30 min on intact or permeabilized Golgi vesicles (100 μg of protein) in the presence (+) or absence (−) of 100 μg of tamarind xyloglucan (XG). Vesicles were permeabilized using 0.05% (v/v) of Triton X-100.

