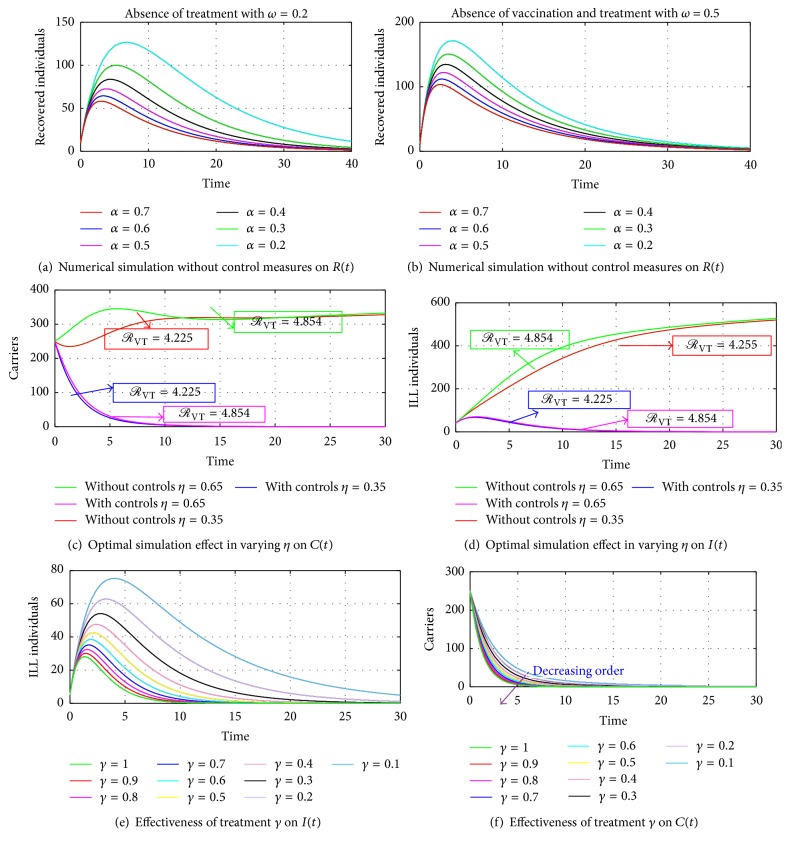
Figure 8.
Simulation results of the optimal control model with η = 0.35-0.65. The solutions for the carriers and ill individuals with α = 0.2 and α = 0.5 give ℛVT = 4.225 and ℛVT = 5.250, respectively. The case where η = 0.35 and η = 0.65 gives ℛVT = 4.225 and ℛVT = 4.854, respectively, which indicates the existence of an unstable disease-free equilibrium and a stable endemic equilibrium. In (e) and (f), vaccination and treatment rates are set to 0.5 and the effectiveness of the treatment control γ varied. (e) and (f) show that as the effectiveness of the treatment control increases, the number of ill individuals reduces faster as compared to the number of carriers.

