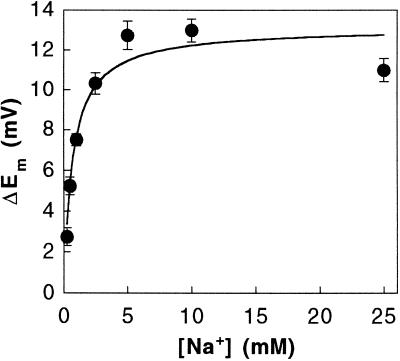
Figure 5.
Effect of increasing Na+ concentrations on NO3−-induced depolarization. Leaf cells were incubated in NaCl-free ASW (sorbitol-ASW) and challenged with saturating NO3− concentrations (100 μm KNO3). Na+ was added as Na2SO4. The data are the means ± se of three independent replicates. The solid line represents a non-linear least squares fit of the data to the Michaelis-Menten equation.

