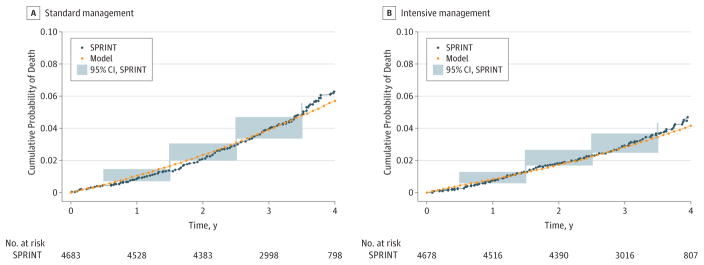
Figure 2. Cumulative All-Cause Mortality.
A, Figure depicts cumulative all-cause mortality in the standard management arm of the Systolic Blood Pressure Intervention Trial (SPRINT) compared with the model. The blue shaded areas are the approximate 95% CIs from SPRINT. B, Figure depicts cumulative all-cause mortality in the intensive management arm of SPRINT compared with the model. The blue shaded areas are the approximate 95% CIs from SPRINT.

