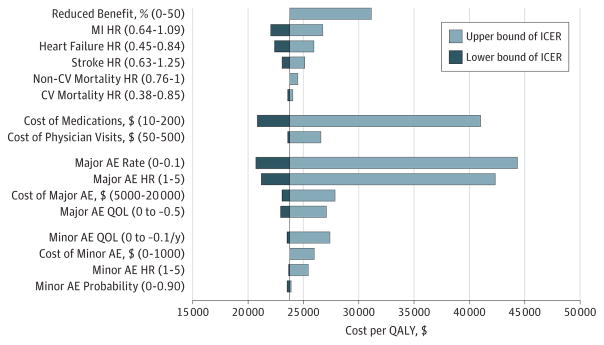
Figure 3. One-Way Sensitivity Analysis of Benefits and Risks of Intensive Blood Pressure Management.
Model parameters were varied between the ranges, which are shown in parentheses. The length of the bar indicates the incremental cost-effectiveness ratio associated with the range. Reduced benefit indicates that all of the hazard ratios (HRs) for benefit are simultaneously attenuated toward the null from a zero percentage reduction (ie, hazard ratios are as reported in the Systolic Blood Pressure Intervention Trial) to 50% (ie, a 50% reduction in the benefit). AE indicates adverse event; CV, cardiovascular; ICER, incremental cost-effectiveness ratio; MI, myocardial infarction; QALY, quality-adjusted life-year; and QOL, quality of life.

