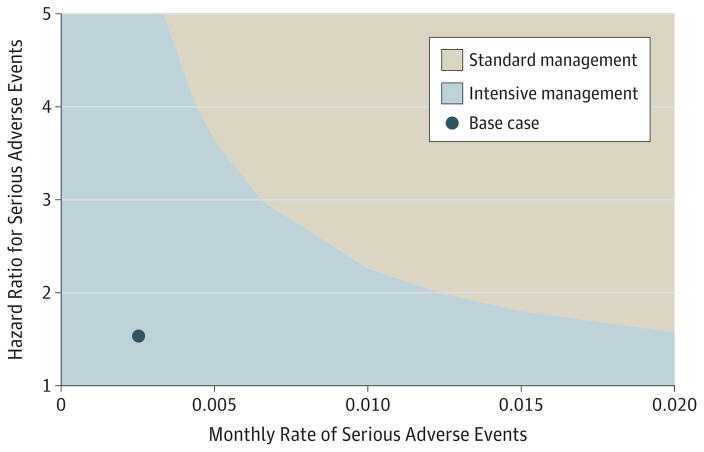
Figure 4. Two-Way Sensitivity Analysis of Serious Adverse Events.
The y-axis depicts an increasing hazard ratio for serious adverse events in the intensive management arm compared with the standard management arm. The x-axis depicts an increasing monthly rate of serious adverse events in the standard management arm. The figure assumes a willingness to pay threshold of $50 000.

