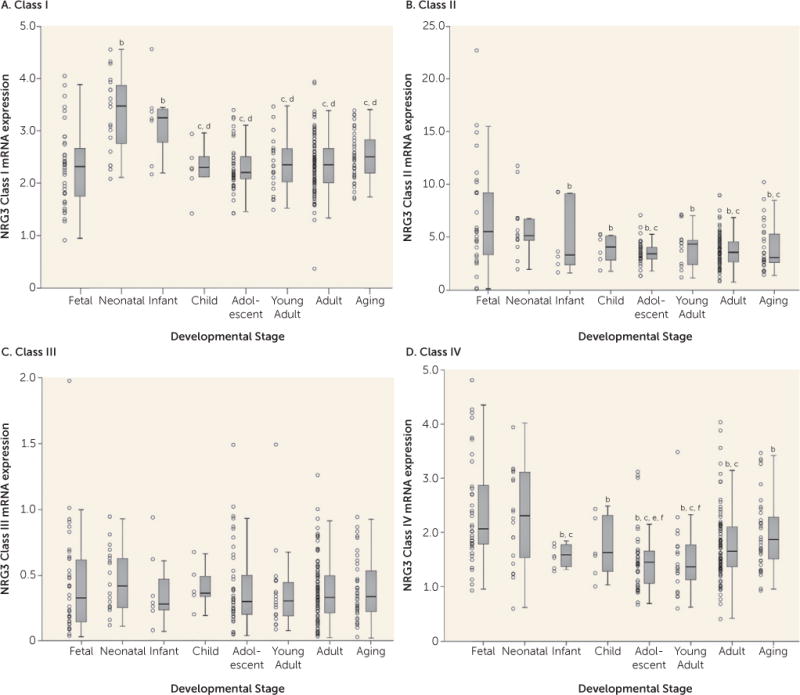
FIGURE 1. NRG3 Class I–IV mRNA Expression in the Dorsolateral Prefrontal Cortex Across the Lifespana.

aFetal=gestational weeks 14–39; neonate=0–0.5 year old; infant=1–3 years old; child=4–6 years old; adolescent=12–18 years old; young adult=19–25 years old; adult=26–55 years old; aging=56–85 years old. Boxplots represent interquartile range above and below the median (horizontal line within box), with whiskers indicating the 1.5× interquartile range. The quantitative, normalized gene expression of each subject is designated by an individual data point.
bp<0.05 compared with fetal stage.
cp<0.05 compared with neonate stage.
dp<0.05 compared with infanthood stage.
ep<0.05 compared with adult stage.
fp<0.05 compared with aging stage.
