
FIGURE 3. Association of NRG3 Class I–IV mRNA Expression With rs10748842 and rs6584400 Genotypes in Mood Disordersa.
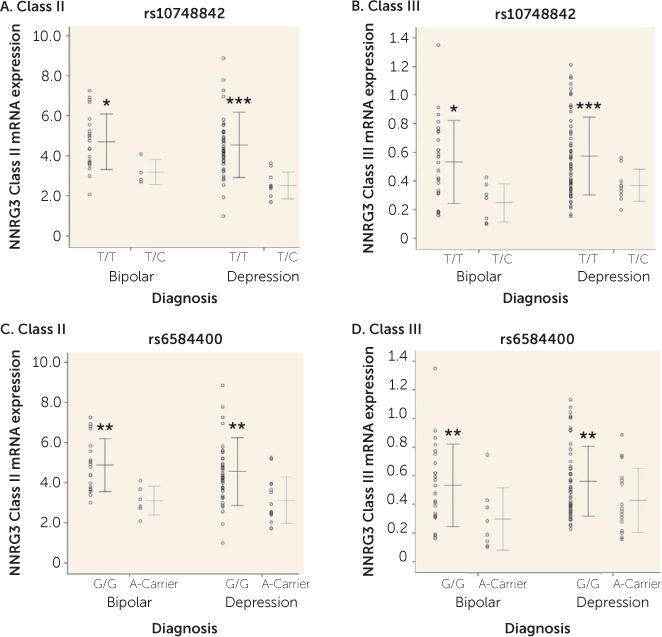
aIndividual data points represent quantitative, normalized subject-level gene expression, with the horizontal line indicating the groups’ mean gene expression and whiskers indicating the standard deviation of the mean. Part A, TT genotype: bipolar disorder, N=22; depression, N=49. Part A, TC genotype: bipolar disorder, N=4; depression, N=10. Part B, TT genotype: bipolar disorder, N=25; depression, N=59. Part B, TC genotype: bipolar disorder, N=7; depression, N=10). Part C, GG genotype: bipolar disorder, N=19; depression, N=45. Part C, A-carrier genotype: bipolar disorder, N=6; depression, N=14. Part D, GG genotype: bipolar disorder, N=24; depression, N=53. Part D, A-carrier genotype: bipolar disorder, N=8; depression, N=16. Significant differences from the nonrisk group are indicated by asterisks.
*p<0.05. **p<0.01. ***p<0.001.