Figure 1.
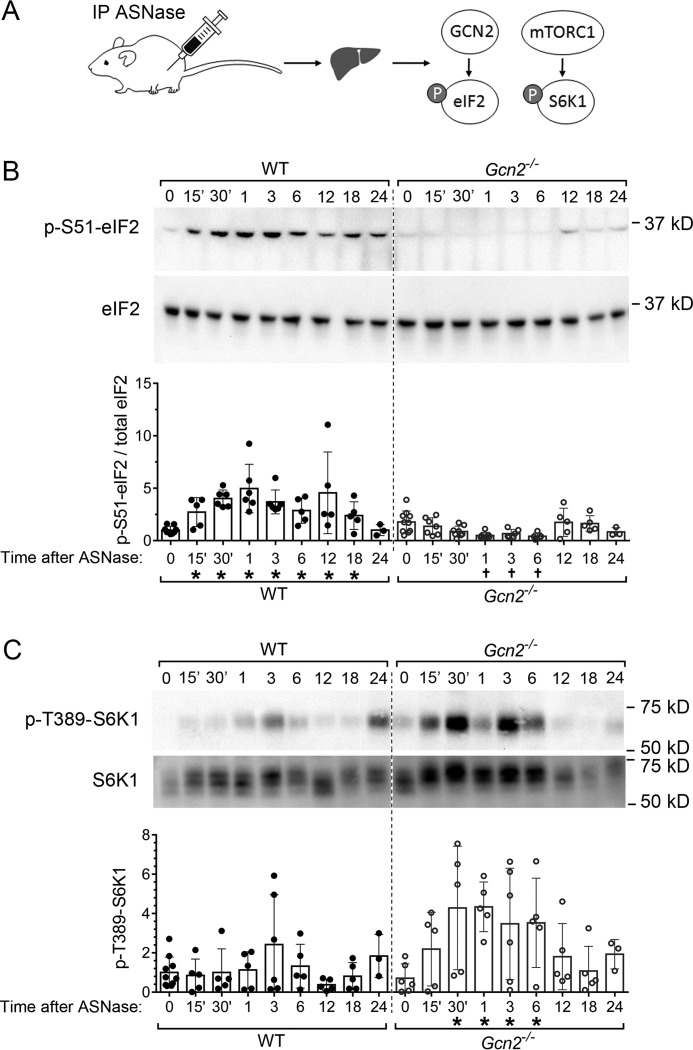
Gcn2 status determines the hepatic eIF2 and mTORC1 response to asparaginase (ASNase). A, schematic diagram of experimental setup. The mice were injected intraperitoneally (IP) with ASNase and killed at regular intervals over 24 h. Liver samples were analyzed for phosphorylation of eIF2 (p-eIF2) and p-S6K1. B, upper panels show representative immunoblots displaying p-eIF2 at serine 51 and eIF2α total protein. Quantitative analysis of individual values for p-eIF2 levels normalized to total eIF2α at each time point is summarized in the bar graph in the lower panel. C, upper panels show representative immunoblots displaying p-S6K1 at threonine 389 and total levels of S6K1. Quantitative analysis of the Thr(P)-389 band intensities at each time point is summarized in the bar graph in the lower panel. Fig. S3 shows images of additional biological replicates. In B and C, circles represent individual liver samples, and bars represent average values across the treatment groups ± S.D. *, significantly higher than values at 0 which are PBS-treated, p < 0.05 by t test; †, significantly lower than values at 0 which are PBS-treated, p < 0.05 by t test.

