Figure 1.
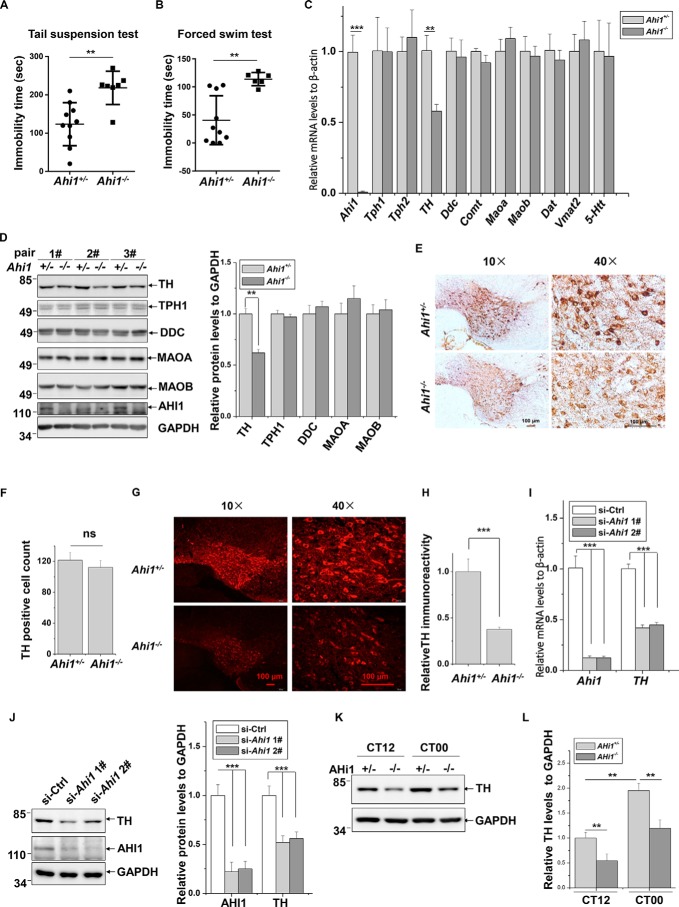
Decreased TH expression in Ahi1 KO mouse midbrains and Ahi1 knockdown cells. A, immobility time in TST was measured in control mice (n = 10) and Ahi1 KO mice (n = 7). **, p < 0.01. B, immobility time in FST was measured in control mice (n = 10) and Ahi1 KO mice (n = 6). **, p < 0.01. C, relative mRNA levels of the indicated genes of Ahi1 KO mouse midbrains and littermate controls were performed by real-time qPCR. **, p < 0.01 (n = 5). D, the indicated protein abundance of Ahi1 KO mouse midbrains and the littermate controls was performed by Western blot analysis. The levels of the indicated proteins relative to GAPDH are shown on the right. **, p < 0.01 (n = 3). E, representative images of TH-DAB staining in VTA of Ahi1 KO mice and the littermate controls are shown at AP −3.5 mm. F, quantification of the TH-positive cells from (E) was shown. ns, no statistical significance (n = 3). G, representative images of TH-fluorescence staining in VTA of Ahi1 KO mice and the littermate controls are shown at AP −3.5 mm. H, intensity of TH immunofluorescence signals in G was analyzed. ***, p < 0.001 (n = 3). I, N2a cells were transfected with the indicated siRNAs. Seventy-two h after transfection, real-time qPCR was performed. *, p < 0.001 (n = 3). J, N2a cells were transfected with indicated siRNAs. Seventy-two h after transfection, the total cell lysates were subjected to immunoblot analysis. The intensities of AHI1 or TH relative to GAPDH (right) were analyzed. ***, p < 0.001 (n = 3). K, TH protein abundance of Ahi1 KO mouse midbrain and littermate controls at CT12 and CT00 by Western blot analysis. L, the relative ratios of TH to GAPDH in I were analyzed from density analysis by one-way ANOVA. Data are presented as means ± S.E. (error bars). **, p < 0.01 (n = 3).

