Figure 2.
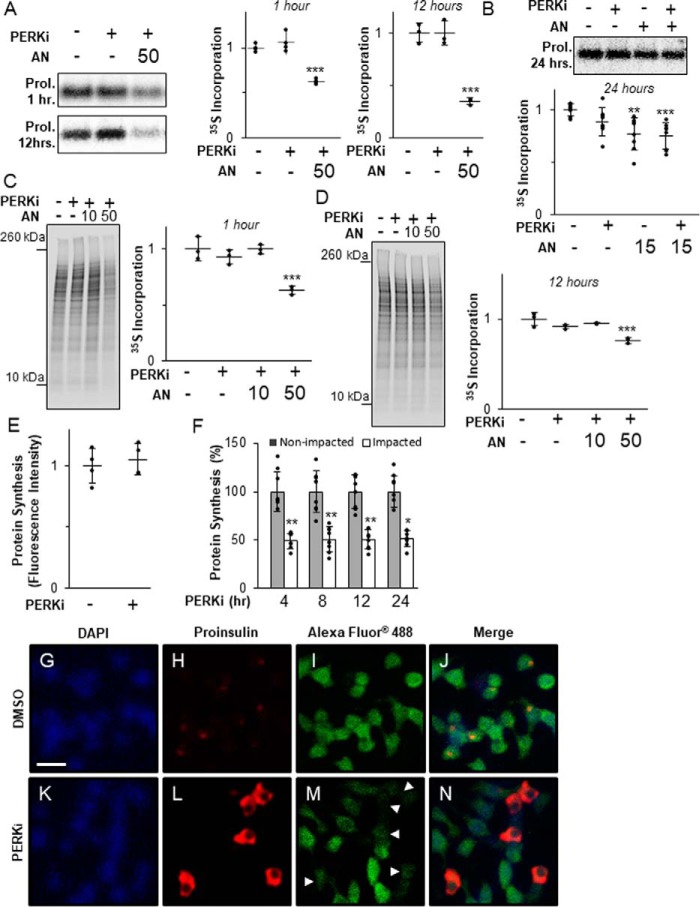
Proinsulin aggregation occurs independently of derepressed protein synthesis. A, INS1 832/13 cells treated for 1 or 12 h with 1 μm PERKi and 50 nm AN. Shown are representative autoradiographs of metabolically labeled proinsulin immunopurified from cell lysates pulse-labeled with [35S]methionine/cysteine for the last 30 min. Quantification was carried out using the ImageQuant software on specialized image files generated using the Storage Phosphor setting on the Typhoon PhosphorImager (GE Healthcare) and represents n = 3 per treatment. Statistical significance is calculated relative to the DMSO control; ***, p < 0.001. B, INS1 832/13 cells treated for 24 h with 1 μm PERKi and 15 nm AN. Shown are representative autoradiographs as described in A. Quantification was carried out as described for A and represents n = 8 per treatment. Statistical significance is calculated relative to the DMSO control; **, p ≤ 0.01; ***, p < 0.001. C, INS1 832/13 cells treated for 1 h with 1 μm PERKi, 10 or 50 nm AN. Shown are representative autoradiographs of metabolically labeled total cell lysates pulse-labeled with [35S]methionine/cysteine for the last 30 min. The entire molecular weight range of each lane was quantified by ImageQuant as described for A. The graph represents n = 3 per treatment. Statistical significance is calculated relative to the DMSO control; ***, p < 0.001. D, INS1 832/13 cells treated for 12 h with 1 μm PERKi, 10 or 50 nm AN. Shown are representative autoradiographs as described in C. Quantification represents n = 3 per treatment. Statistical significance is calculated relative to the DMSO control; ***, p < 0.001. E, INS1 832/13 cells treated for 12 h with 1 μm PERKi. The methionine analog HPG (50 μm) was added 1 h before harvest. Newly synthesized proteins were quantified by fluorescence detection of the incorporated derivatized methionine using ImageJ software as described under “Experimental procedures.” Quantification represents n = 4 per treatment. Statistical significance was calculated relative to the DMSO control. F, INS1 832/13 cells treated for 4, 8, 12, and 24 h with 1 μm PERKi. HPG was added for the last hour as described in A. Intensity of staining was measured for Impacted and non-impacted cells based on proinsulin staining. Quantification represents n = 8 per treatment. Statistical significance was calculated relative to the non-impacted control; *, p ≤ 0.05; **, p < 0.01. G–N, immunodetection of DAPI (blue), proinsulin (red), and newly synthesized protein (green) in DMSO-treated INS1 832/13 cells (B–E) and 4-h PERKi-treated INS1 832/13 cells (F-I). White arrowheads indicate impacted cells. Scale bar = 20 μm.

