Figure 3.

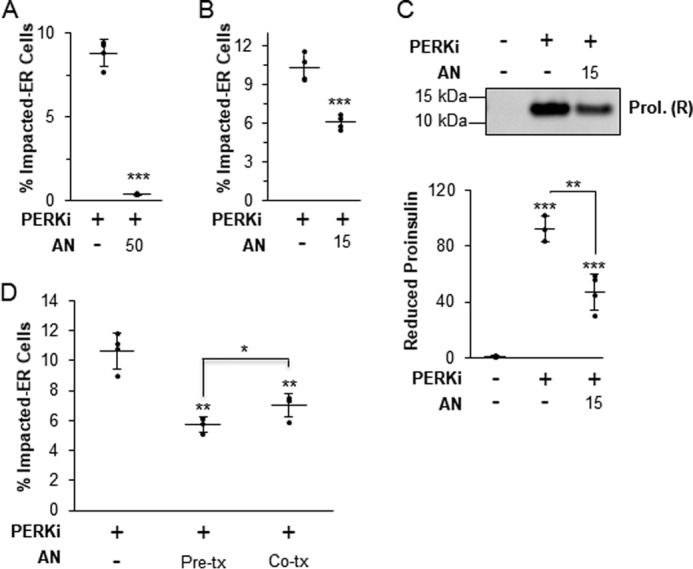
Protein aggregation requires new protein synthesis. A, INS1 832/13 cells treated for 24 h with 1 μm PERKi and 50 nm AN. Quantification represents n = 4 per treatment. Statistical significance is calculated relative to the PERKi only treatment; ***, p < 0.001. B, INS1 832/13 cells treated for 24 h with 1 μm PERKi and 15 nm AN. Quantification represents n = 8 per treatment. Statistical significance is calculated relative to the PERKi only treatment; ***, p < 0.001. C, INS1 832/13 cells treated for 24 h with 1 μm PERKi and 15 nm AN. HMW protein aggregates were pelleted and electrophoresed under reducing conditions. A representative blot is shown with quantification representing n = 4 per treatment. Statistical significance is calculated relative to the DMSO control or as indicated; **, p ≤ 0.01; ***, p < 0.001. D, INS1 832/13 cells treated for 24 h with 1 μm PERKi and 15 nm anisomycin was added either 15 min prior to addition of PERKi (Pre-tx) or at the same time as the PERKi (Co-tx). Quantification represents n = 4 per treatment. Statistical significance is calculated relative to the PERKi only treatment or as indicated; *, p ≤ 0.05; **, p < 0.01.
