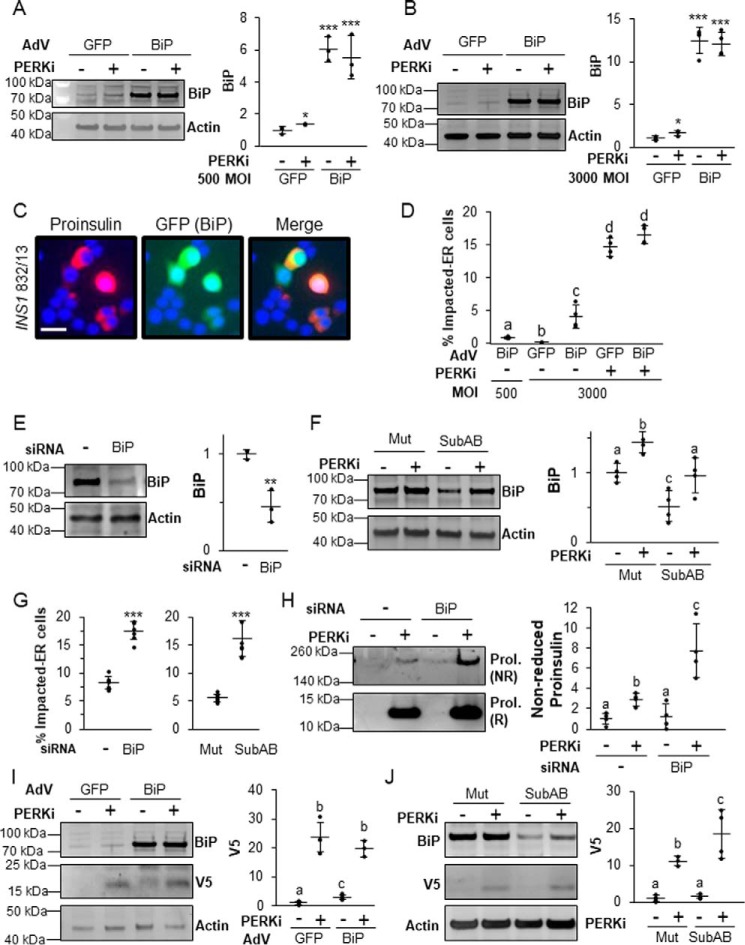
Figure 6.
The balance of BiP is important in properly regulating proinsulin trafficking. A and B, INS1 832/13 cells infected with a BiP-overexpressing adenovirus or control adenovirus overexpressing GFP at 500 (A) or 3000 (B) m.o.i. prior to treatment for 24 h with 500 nm PERKi. A representative blot is shown with quantification representing n = 4 per treatment. Statistical significance was calculated relative to the Adv-GFP/DMSO control; *, p ≤ 0.05; ***, p < 0.001. C, immunostaining of INS1 832/13 cells infected with AdV-BiP (500 MOI) using proinsulin (red) and DAPI (blue). The GFP image shows that the cells with Impacted-ER are infected with the BiP-overexpressing adenovirus. Scale bar = 30 μm. D, INS1 832/13 cells infected with AdV-BiP as described in A and B followed by treatment for 24 h with 500 nm PERKi. Quantification represents n = 4 per treatment. Different letters indicate statistically significant difference. E, INS1 832/13 cells transfected with BiP siRNAs or a non-targeting negative control siRNA. A representative blot is shown with quantification representing n = 4 per treatment. Statistical significance is calculated relative to the negative siRNA control; **, p < 0.01. F, INS1 832/13 cells treated for 24 h with 500 nm PERKi and treated for the final 1 h with 0.5 μg/ml of Subtilase cytotoxin (SubAB) or the inactive mutant SubAA272B (Mut). A representative blot is shown with quantification representing n = 4 per treatment. Different letters indicate statistically significant differences. G, INS1 832/13 cells transfected with BiP or negative control siRNAs or treated with SubAB or the inactivated mutant in combination with PERKi treatment as was done in E and F. Quantification represents n = 4 per treatment. Statistical significance is calculated relative to the negative siRNA control or the SubAA272B inactive mutant treated with PERKi; ***, p < 0.001. H, INS1 832/13 cells were transfected with BiP or negative control siRNAs and treated for the final 24 h with 1 μm PERKi. HMW protein aggregates were pelleted and electrophoresed as described in the legend to Fig. 1J. Representative blots are shown with quantification representing n = 4 per treatment. Different letters indicate statistically significant differences. I, INS1 832/13 cells were transfected for 48 h with V5-tagged wild-type proinsulin–KDEL (INS+-KDEL). Twenty-four hours after transfection, cells were then infected with a BiP-overexpressing adenovirus or control adenovirus overexpressing GFP at 500 m.o.i. prior to treatment for 24 h with 1 μm PERKi. Representative blots are shown with quantification representing n = 4 per treatment. Different letters indicate statistically significant differences. J, INS1 832/13 cells were transfected for 48 h with V5-tagged wildtype proinsulin-KDEL (INS+-KDEL). Cells were treated for the final 24 h with 1 μm PERKi and the final 1 h with 0.5 μg/ml of SubAB or the inactive mutant SubAA272B (Mut). Representative blots are shown. Different letters indicate statistically significant differences.

