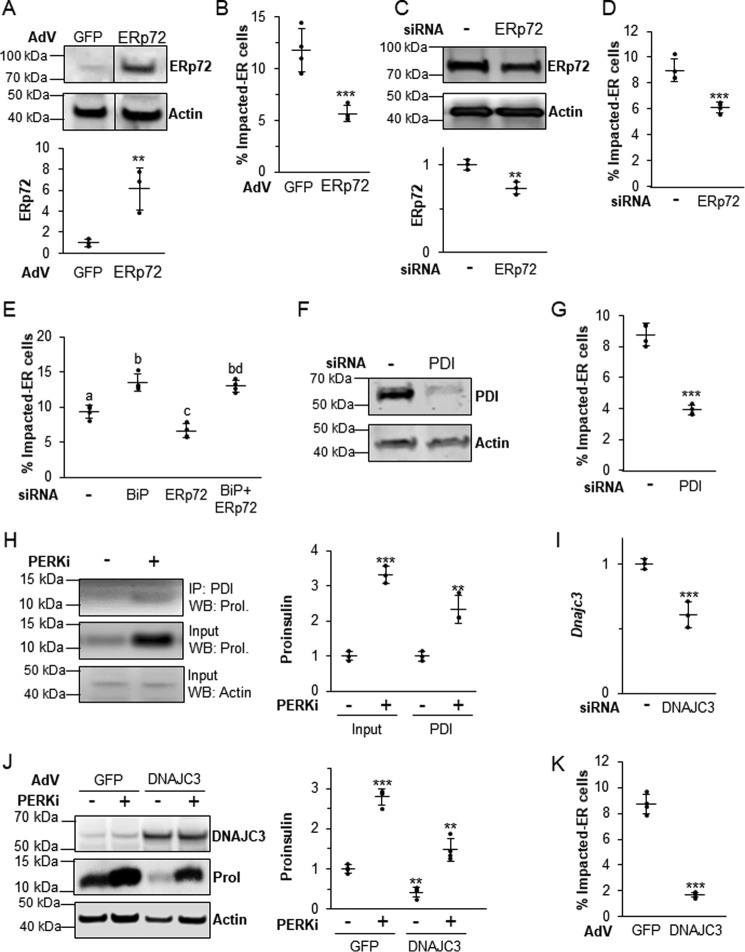
Figure 8.
The balance of other ER chaperones is also important in properly regulating proinsulin trafficking. A, INS1 832/13 cells infected with an ERp72-overexpressing adenovirus or control adenovirus overexpressing GFP at 1000 m.o.i. A representative blot is shown with quantification representing n = 3 per treatment. Statistical significance was calculated relative to the AdV-GFP control; **, p < 0.01. B, INS1 832/13 cells infected with AdV-ERp72 as described in A followed by treatment for 24 h with 1 μm PERKi. Quantification represents n = 4 per treatment. Statistical significance is calculated relative to AdV-GFP/PERKi; ***, p < 0.001. C, INS1 832/13 cells transfected with ERp72 siRNAs. A representative blot is shown with quantification representing n = 4 per treatment. Statistical significance is calculated relative to the negative siRNA control; **, p < 0.01. D, INS1 832/13 cells were transfected with siRNAs as described in C, and 1 μm PERKi was added for the last 24 h prior to harvest. Quantification represents n = 8 per treatment. Statistical significance is calculated relative to the negative siRNA treated with PERKi; ***, p < 0.001. E, INS1 832/13 cells were transfected with BiP and ERp72 siRNAs, and 1 μm PERKi was added for the last 24 h prior to harvest. Quantification represents n = 4 per treatment. Different letters indicate statistically significant differences. F, INS1 832/13 cells transfected with PDI or negative control siRNA. A representative blot is shown with quantification representing n = 4 per treatment. Statistical significance is calculated relative to the negative siRNA control; *, p ≤ 0.05. G, INS1 832/13 cells were transfected with siRNA as described in F, and 1 μm PERKi was added for the last 24 h prior to harvest. Quantification represents n = 4 per treatment. Statistical significance is calculated relative to the negative siRNA treated with PERKi; ***, p < 0.001. H, INS1 832/13 cells treated for 24 h with 1 μm PERKi and then immunoprecipitated (IP) with PDI antibody. Representative image of IP/Western blot (WB) is shown with quantification representing n = 3 per treatment. Statistical significance is calculated relative to the input or IP controls; **, p ≤ 0.01; ***, p < 0.001. I, INS1 832/13 cells were transfected with ATF6 siRNAs for 48 h, mRNA quantification represents n = 3 per treatment. Statistical significance is calculated relative to the negative siRNA control; ***, p < 0.001. J, INS1 832/13 cells infected with a DNAJC3-overexpressing adenovirus or control adenovirus overexpressing GFP at 1000 m.o.i. followed by treatment for 24 h with 1 μm PERKi. Quantification represents n = 4 per treatment. Statistical significance is calculated relative to AdV-GFP/PERKi; ***, p < 0.001. K, INS1 832/13 cells infected with AdV-DNAJC3 as described in J. A representative blot is shown with quantification representing n = 3 per treatment. Statistical significance was calculated relative to the AdV-GFP control; **, p < 0.01; ***, p < 0.001.

