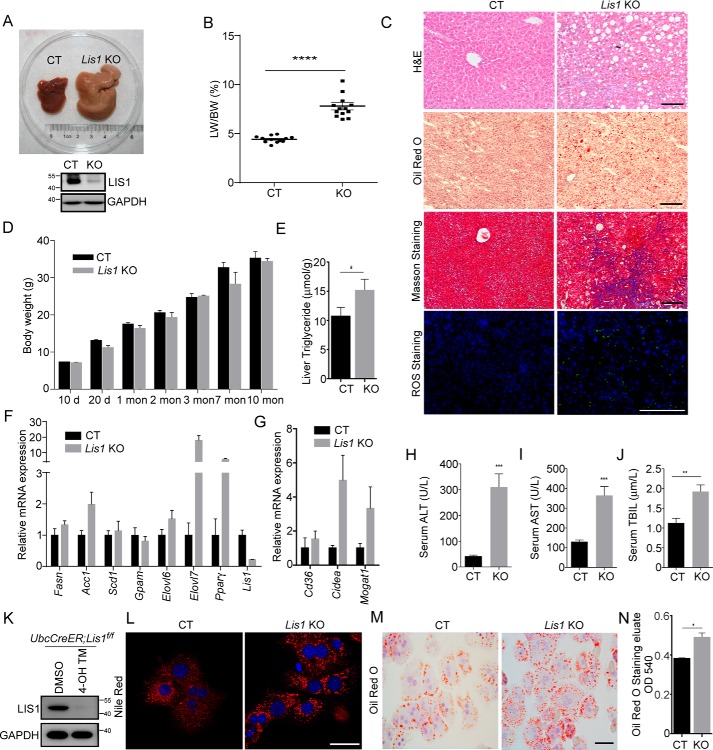
Figure 1.
Liver-specific knockout of Lis1 results in fatty liver in mice. A, gross morphology of control (left) and Lis1 KO (right) mouse liver at 2 months. The Lis1 mutant displayed an enlarged liver. B, the ratio of liver weight (LW) to gross body weight (BW) of control and Lis1 KO mice at 2 months. C, stained sections of livers from control and Lis1 KO mice at 2 months with the indicated methods. Increased lipids, fibrosis, and ROS were observed in Lis1 KO livers. D, body weight of control and Lis1 KO mice at different ages. E, liver triglyceride quantification; n = 5. F, gene expression analysis by quantitative PCR showing increased lipogenesis in Lis1 KO livers; n = 4. G, gene expression analysis by quantitative PCR showing increased lipid uptake and storage in Lis1 KO livers; n = 4. H–J, quantifications of serum ALT (H), AST (I), and TBIL (J). Severe liver injury was observed in Lis1 KO mice. K, Western blotting analysis of UbcCreER;Lis1f/f hepatocytes treated with DMSO or 4-OH tamoxifen (4-OH TM) with the indicated antibodies. L, Nile Red staining of liver sections from control and Lis1 KO primary hepatocytes. Accumulation of lipids was found in primary hepatocytes in the absence of Lis1. M, Oil Red O staining of liver sections from control and Lis1 KO primary hepatocytes. N, relative amount of Oil Red O eluted from control and Lis1 KO primary hepatocytes was measured by spectrophotometer; n = 3 per group. The scale bars represent 100 μm in C, 10 μm in L, and 20 μm in M.

