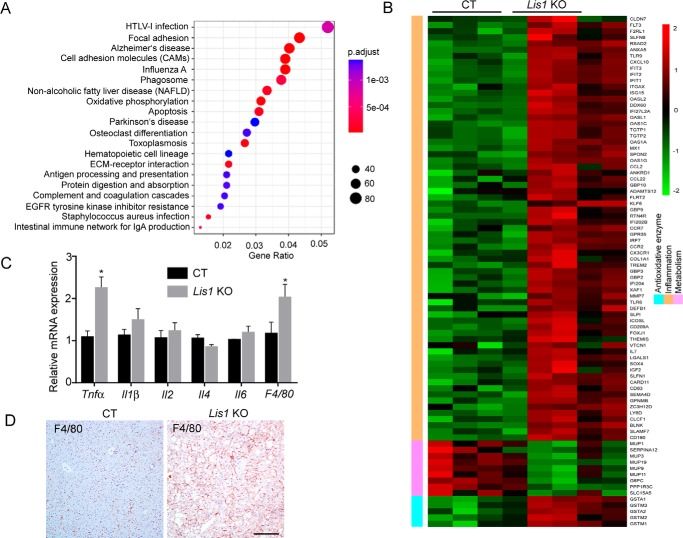
Figure 3.
RNA-Seq analysis of Lis1 KO livers. A, top pathways that were enriched in differentially expressed genes identified by RNA-Seq analysis in Lis1 KO livers compared with control livers. B, heat map analysis of the highly up-regulated (red) and down-regulated (green) metabolism, inflammatory and antioxidant genes in Lis1 KO livers compared with controls. C, quantitative PCR analysis of cytokines in control and Lis1 KO livers; n = 4. D, immunohistochemistry staining revealed increased macrophages in Lis1 KO livers by F4/80 antibody; n = 5.

