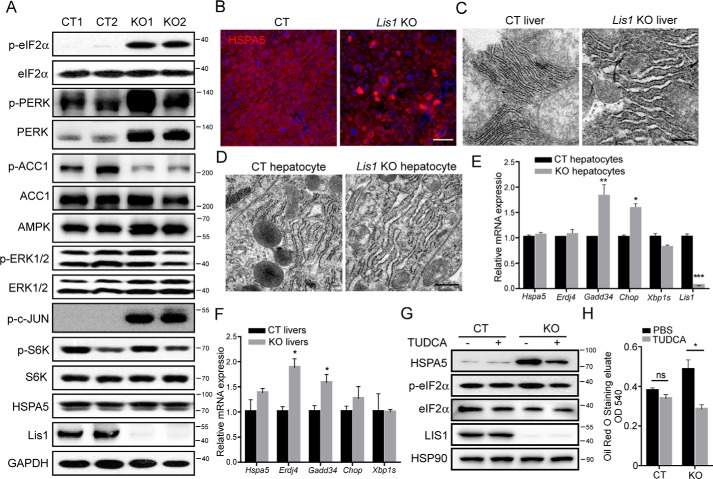
Figure 4.
Loss of Lis1 in mouse livers results in an elevated ER stress response in association with an enlarged ER size. A, Western blot analysis of control and Lis1 KO mouse livers at 2 months with the indicated antibodies. B, immunofluorescent analysis of livers from control and Lis1 KO mice with HSPA5 antibody. HSPA5 expression was substantially increased in 10% Lis1 KO hepatocytes. C, representative TEMs of 2-month-old control and Lis1 KO mouse livers. Enlarged ER was found in Lis1 KO hepatocytes. D, representative TEMs of control and Lis1 KO primary hepatocytes. E, quantitative PCR analysis in control and Lis1 KO primary hepatocytes; n = 4. F, quantitative PCR analysis in control and Lis1 KO livers at 3 months; n = 3. G, Western blot analysis of control and Lis1 KO primary hepatocytes with the indicated antibodies using the indicated treatment. p-eIF2α and HSPA5 expression was elevated after acute deletion of Lis1 in vitro. TUDCA treatment reduced the expression of p-eIF2α and HSPA5 in Lis1 KO hepatocytes. H, quantification of relative Oil Red O amount in primary control and Lis1 KO hepatocytes treated with DMSO or TUDCA; n = 3. The scale bars represent 100 μm in B, 500 nm in C and F.

