Figure 5.
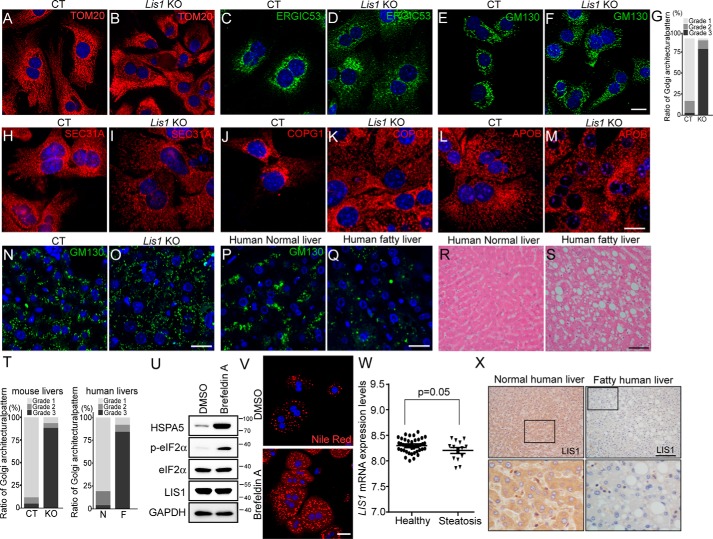
Hepatocytes in Lis1 KO mouse and human fatty livers display diffused Golgi stacks. A–F, immunofluorescent staining of control and Lis1 KO primary hepatocytes with the indicated antibodies revealed the disorganization of mitochondria and Golgi stacks. G, quantification of the Golgi architectural changes in E and F. H–K, immunofluorescent staining with the indicated antibodies revealed the disorganization of COPII (H and I) and COPI (J and K) vesicles in Lis1 KO primary hepatocytes. L and M, immunofluorescent staining with APOB antibody revealed the abnormal distribution of APOB vesicles in Lis1 KO primary hepatocytes. N and O, immunofluorescent staining of control and Lis1 KO mouse livers with GM130 antibody. P and Q, immunofluorescent staining of human normal liver and fatty liver sections with GM130 antibody revealed disruption of normal Golgi structure in human fatty livers in vivo. R and S, H&E staining of human normal liver and fatty liver sections. T, quantifications of the architectural changes of the Golgi apparatus by GM130 staining in N–Q. N, normal human liver; F, fatty human liver. U, Western blotting analysis revealed elevated p-eIF2α expression in brefeldin A-treated primary hepatocytes. V, staining of primary hepatocytes using Nile Red revealed the accumulation of lipids in brefeldin A-treated cells. W, relative LIS1 mRNA levels in the livers of human healthy controls and NAFLD samples from data set GSE48452. X, immunohistochemistry staining of human normal and fatty liver sections with LIS1 antibody. LIS1 expression was reduced in human fatty livers. Higher magnification of boxed areas is shown in the lower panel. The scale bars represent 10 μm in A–F; 20 μm in H–M; 50 μm in N–Q; and 25 μm in V; and 100 μm in R, S, and X.

