Figure 3.
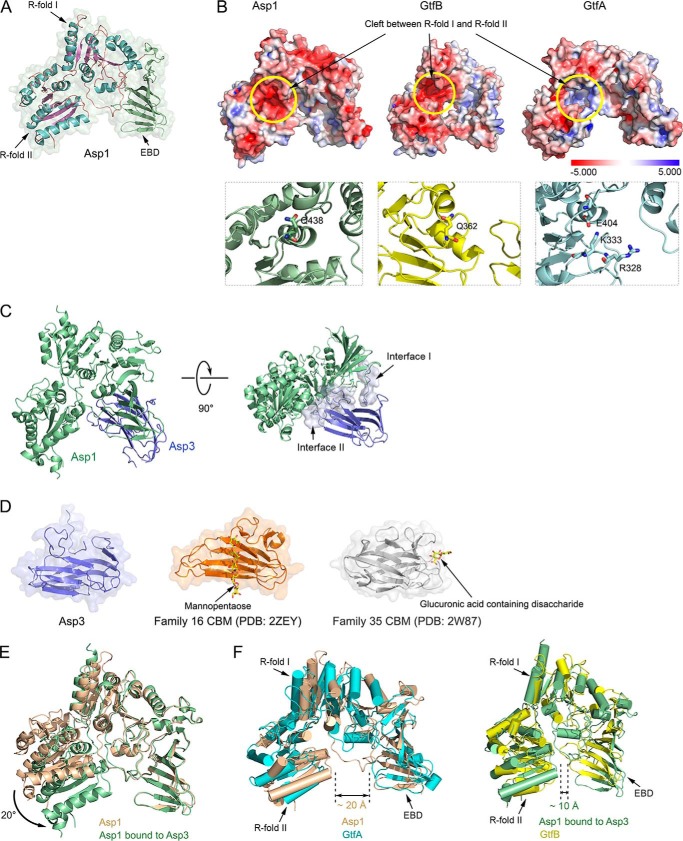
Crystal structures of Asp1 and Asp3. A, crystal structure of Asp1 alone. Shown is a ribbon diagram of the model embedded in a space-filling presentation. The helices and the β-sheets of Rossmann folds I and II (R-folds I and II) are shown in cyan and purple, respectively. The extended β-sheet domain (EBD) is shown in green. B, upper panels show space-filling models of Asp1, GtfB, and GtfA, with the electrostatic surface calculated with the Adaptive Poisson-Boltzmann Solver, as implemented in PyMOL, using a scale from −5.000 to 5.000 (bottom). The yellow circle indicates the cleft between the R-folds, which is negatively charged for Asp1 and GtfB and positively charged for GtfA. The lower panels show magnified views of the cleft in ribbon presentation. Residues in the active site of GtfA and the corresponding residues in the enzymatically inactive Asp1 and GtfB are shown in stick presentation. C, structure of the Asp1/3 complex. Shown is a ribbon diagram of the model, with Asp1 in green and Asp3 in blue. The right panel also shows a space-filling model of the interfaces between Asp1 and Asp3. D, comparison of Asp3 with two CBM families. The two CBMs shown bind their sugar substrates at different sites. E, comparison of the structures of Asp1 in isolation and when bound to Asp3 (brown and green, respectively). F, comparison of the open conformation of Asp1 in isolation with GtfA (left panel: brown and cyan, respectively), and of the closed conformation of Asp1 when bound to Asp3 with GtfB (right panel: green and yellow, respectively).

