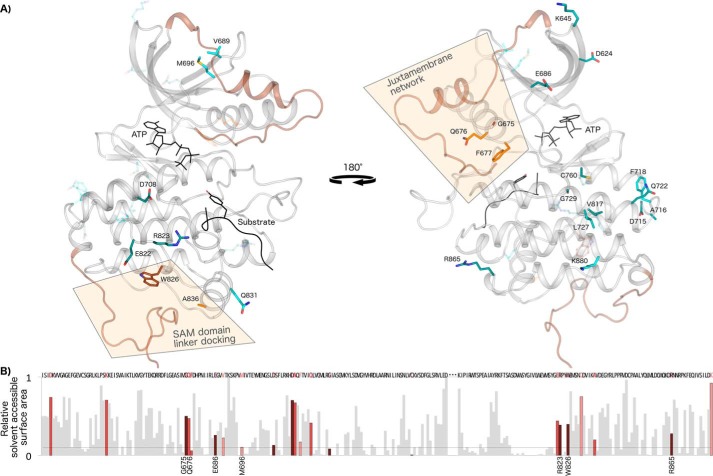
Figure 2.
Networks of Eph-specific residues in distinct functional regions of the kinase tertiary structure. A, key distinguishing residues of the Eph family mapped onto a model structure of human EphA3. ATP and peptide substrate (Protein Data Bank code 3FY2) are shown in black. The juxtamembrane (modeled from Protein Data Bank code 2QO2) and the SAM domain linker (modeled from Protein Data Bank code 2QOC) are shown in brown. The activation loop was modeled using active EphA2 (Protein Data Bank code 4TRL) and active human Lck as a template (Protein Data Bank code 3LCK). The 25 most distinguishing Eph-specific residues (columns with black dot in Fig. 1) are shown as sticks, which are colored darker to lighter based on the greater or lesser contrast between Ephs and other tyrosine kinases at that position. B, relative solvent-accessible surface area of residues across the kinase domain calculated from an active EphA3 structure (Protein Data Bank code 2QOC). Eph-specific residues are highlighted in dark to light red relative to the strength of the sequence constraint, with darker red indicating more highly constrained residues. Data for the disordered activation loop is omitted and marked by ellipses.

