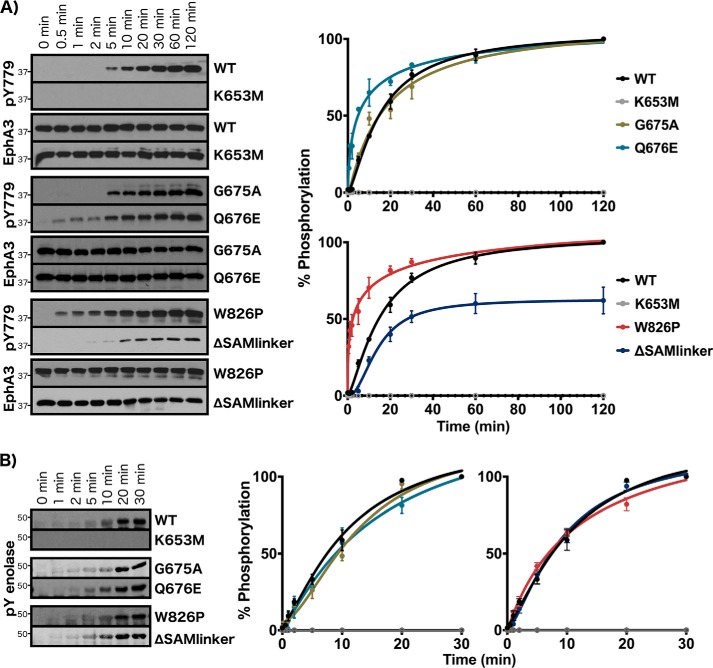
Figure 4.
Experimental analysis of juxtamembrane and SAM linker network residues. A, autophosphorylation time series of juxtamembrane and SAM linker network mutants. Phosphorylation levels of the activation loop site were detected (pTyr779). B, enolase phosphorylation time series. Phosphorylation levels in A and B were quantified by densitometry and normalized against total protein levels. Error bars represent standard deviation between three independent experiments.

