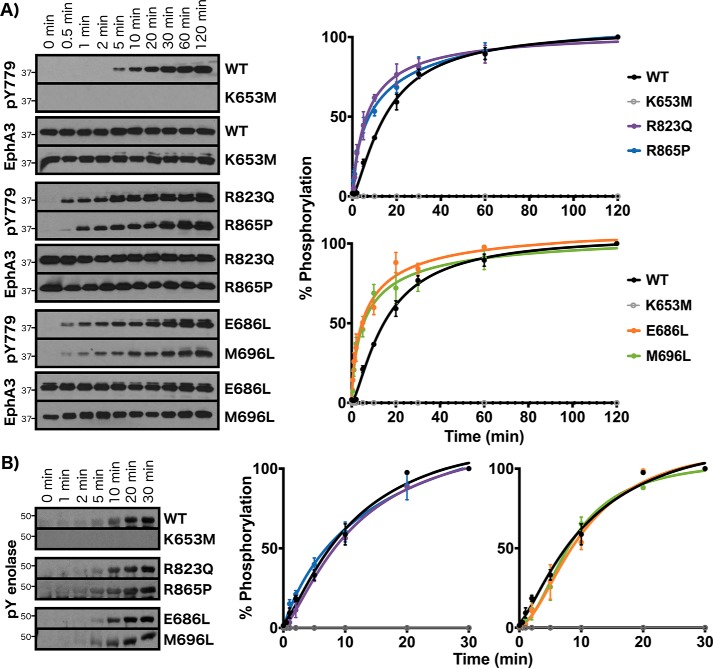
Figure 7.
Experimental analysis of Eph-specific residues of unknown functions. A, autophosphorylation time series of WT, kinase-dead (K653M), R823Q, R865P, E686L, and M696L mutants. Phosphorylation levels of the activation loop site were detected (pTyr779). B, enolase phosphorylation time series. Phosphorylation levels in A and B were quantified by densitometry and normalized against total protein levels. Error bars represent standard deviation between three independent experiments.

