Figure 4.
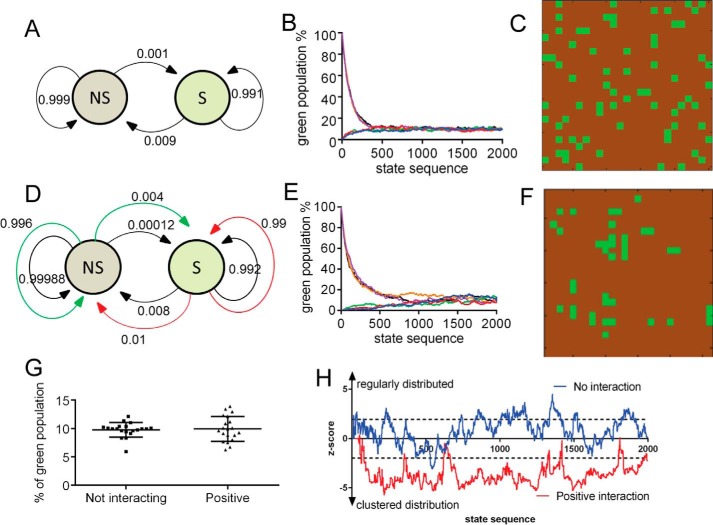
Features of spatially interacting Markov chain processes. A–C, model without interactions between cells. A, Markov graph of transition probabilities between bulk (NS, in brown) and stem cell (S, in green) states. B, state-sequence plot of 625 cells composed of either 100% N or 100% NS state cells. Each color represents one run. After ∼1000 steps the two populations reach a steady-state equilibrium. C, spatial pattern at steady-state equilibrium. Approximately 25% S state cells have a direct contact with another S state cell. D–F, models with positive cell–cell interactions. D, Markov graph of transition probabilities between bulk (NS) and stem cell (S) states. The outer colored lines represent the probabilities of changing states, if a cell in the opposite state is present in one of the nearest neighbor positions. E, state-sequence plot of 625 cells, if cells are either 100% in the N or 100% in the NS state. Each color represents one run. Of note, both curves (most notably for the ones in the NS state) have lag phases. F, spatial pattern at steady-state equilibrium. Most S cells are organized in clusters. G, in both models (not-interacting versus interacting), at equilibrium, the fraction of S state cells is essentially the same. Note the higher variability in the positive interaction model. H, the statistics on NNI index (z score) shows significant cluster formation in the interacting model.

