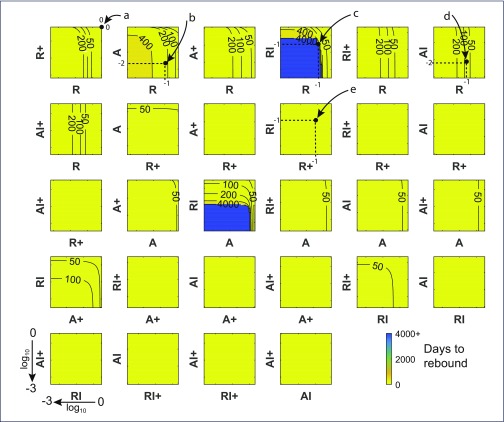
Figure 2.
Time to rebound for chronic infection. Contour plots displaying number of days to pVL rebound (HIV RNA = 50 copies/mL) when pairs of cell levels after 6 years of ART, commenced at CHI, are reduced between 0 and 3 log10 prior to ART interruption, using the optimal parameter set. The top right corner of each plot displays the days to rebound with 0 change in the pair of states and values (21 days); points to the lower-left show the effects of decreasing values of the two components on a log10 scale where the lower-left corner of each plot shows the number of days to rebound when both components are reduced by 3 log10 (1000-fold). After 6 years of ART, very few cells contained linear unintegrated HIV DNA so that decreases in their number had no impact on viral rebound, nor did cells containing defective integrated HIV DNA or the dead-end episomal forms, hence these cell components were not included. A panel that does not contain any contours, and is filled with the one colour, denotes rebound times <50 days for all values of the components. Resting cells are denoted by R, activated cells by A; dividing cell subsets contain a + in their name; subsets containing I denote cells with integrated HIV DNA; so for example RI+ describes resting dividing cells containing integrated HIV DNA. Simulations were limited to 4000 days after ART cessation so a failure to rebound by that time (blue regions) likely indicated continued suppression and infection loss. Examples: point ‘a’ has no change in either of the R and R+ subsets resulting in rebound after 21 days; point ‘b’ denotes a 1 log10 decrease in the number of R cells and a 2 log10 decrease in numbers of A cells immediately prior to ART cessation, resulting in pVL rebound occurring in the 200 to 400 day range; point ‘c’ denotes a 1 log10 decrease in each of the R and RI components yielding no rebound by 4000 days; point ‘d’ denotes a 1 log10 decrease in R cells and a 2 log10 decrease in AI cells, delaying rebound to the 50 to 100 day range. Since these contours are vertical, changes in the AI component have no impact on rebound, so that all change is due to the R component; point ‘e’ denotes a 1 log10 decrease in R+ cells and the ‘latent reservoir’ of RI cells and giving rise to rebound within 50 days – hence targeting the latent reservoir itself is not sufficient to markedly impact viral suppression

