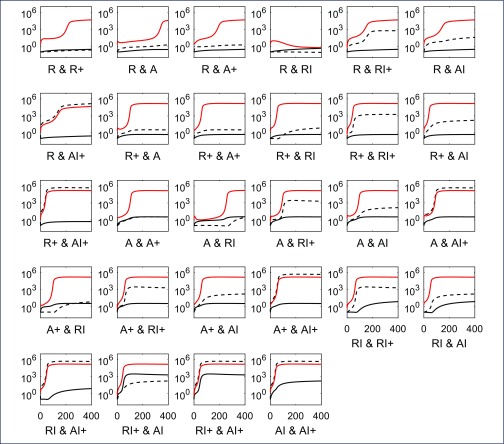
Figure 3.
HIV dynamics over the days following a 10-fold reduction in each of the cell components of the displayed pair, and treatment interruption after 6 years of ART commenced at CHI. Dynamics of the first component relative to starting value (prior to reduction) shown as black solid line with the second cell component as black dashed line while pVL is illustrated with a red line

