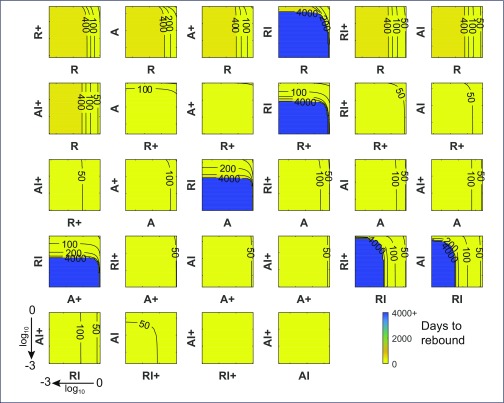
Figure 4.
Time to rebound for when ART is commenced in primary infection. Contour plots displaying number of days to pVL rebound (HIV RNA = 50 copies/mL) when pairs of cell levels after 6 years of ART, commenced at PHI, are reduced between 0 and 3 log10 prior to ART interruption, using the optimal parameter set

