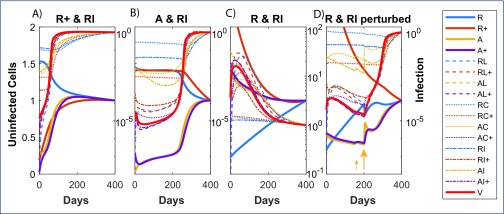
Figure 5.
Three combinations of 10-fold pairwise reductions in cell subsets prior to ART interruption with differing rebound dynamics for the CHI case: (A) immediate rebound; (B) rebound after 200 days; (C) no rebound. Panel (D) shows the scenario in panel (C) but where activation rates β0, β1 were increased 10-fold over a period of 5 days starting at day 150 for a period of 5 days, and 100-fold starting at day 200, reflecting spikes in immune activation from opportunistic infections. In each panel, pVL and all cell subsets are scaled relative to their day 400 levels to bring each component roughly to a similar range; uninfected cell subsets are shown on a linear scale relative to the left y-axes that all range between 0 and 2, while the infected cell subsets and pVL are shown on a log scale relative to the right y-axes

