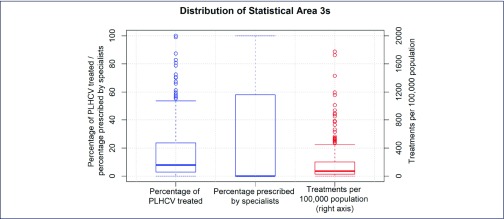
Figure 2.
Heterogeneity of treatments measures across Australia's Statistical Area 3 geographical regions. The estimated percentage of people living with HCV who were treated (blue, left); percentage of treatments prescribed by specialists (blue, centre); and treatments per 100,000 population (red, right). Boxplot whiskers represent observations greater than the 90th percentile or less than the 10th percentile. The right-hand y-axis scale excludes a single outlier, Adelaide City, which had 3834 treatments per 100,000 (897 treatments). The median of zero on the central bar indicates that greater than 50% of geographical areas had no specialist prescriptions

