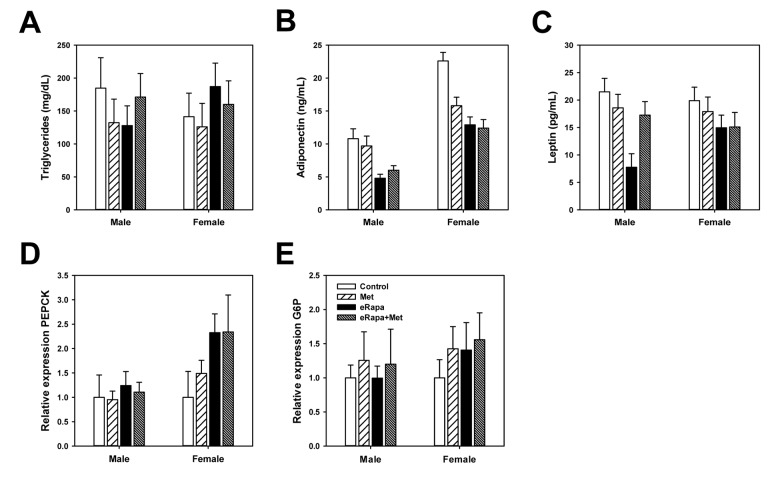
Figure 4.
Rapamycin and metformin effects on circulating metabolic markers. (A) Triglycerides, (B) Adiponectin and (C) Leptin in plasma collected from fed mice following 9 months of treatment on the indicated diets. For A-C, n=8-10 for all groups. Rapamycin and metformin effects on hepatic gluconeogenesis. (D) relative phosphoenolpyruvate carboxykinase (PEPCK) expression and (E) relative glucose 6-phosphatase (G6P) expression in liver from male and female mice fed indicated diets. For D and E, n = 5 for all groups. For all, bars represent mean values for indicated group ± SEM.

