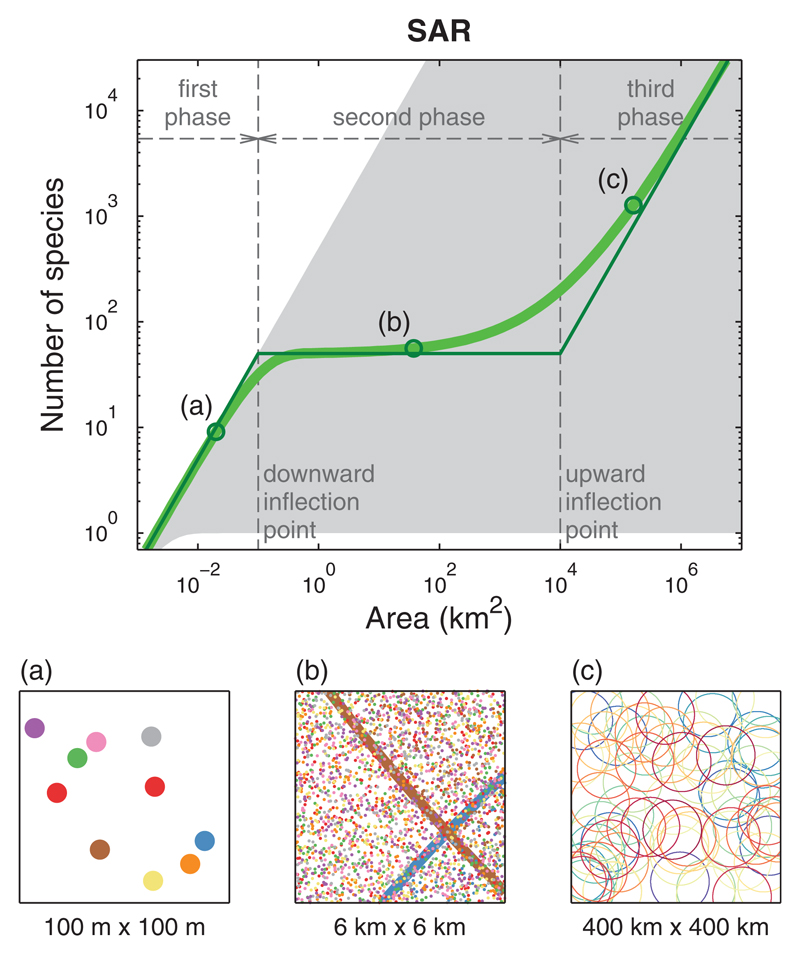
Figure 1.
Our model predicts a triphasic species–area relationship (SAR). A log-log plot of number of species S(A) against observation area A has three distinct phases. Top panel: Exact solution of model (thick green line) and piecewise linear approximation (thin green line). The shaded region indicates the set of possible SARs for a fixed configuration of individuals. For points on the upper boundary, each individual belongs to a different species (see also Storch, 2016); for points on the lower boundary, all individuals belong to the same species. Bottom panel (a): In the first phase almost all individuals (represented by dots) in the observation area belong to different species (represented by colours). Bottom panel (b): In the second phase the observed species have many individuals in the observation area. Some species range boundaries (represented by lines) are visible in the observation area. For clarity, only 20% of the species are shown. Bottom panel (c): In the third phase, the species ranges of the observed species (represented by circles) are for the most part included in the observed area. For clarity, only 10% of the species are shown. Parameter values: λI = 10, λS = 0.005, Q = 104

