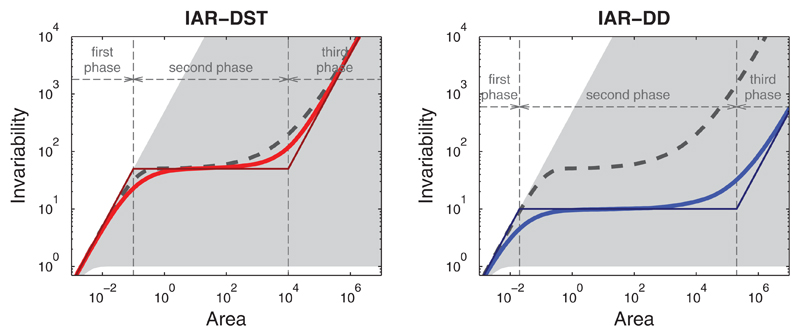
Figure 2.
Our model predicts triphasic invariability–area relationships (IARs). We plot ecosystem invariability I(A) against observation area A under two decorrelation assumptions. Left panel: Decorrelation by species turnover (IAR-DST; in red). Exact model solution in thick red line and piecewise linear approximation in thin red line. Right panel: Decorrelation by distance (IAR-DD; in blue). Exact model solutions in thick blue line and piecewise linear approximations in thin blue line. The species–area relationship (dashed black line) is identical in the two panels, and coincides with the thick green line in Figure 1. The shaded region indicates the set of possible IARs for a fixed configuration of individuals. For points on the upper boundary, all individuals have independent fluctuations; for points on the lower boundary, all individuals have perfectly correlated fluctuations. Parameter values: λI=10, λS=0.005, Q=104, mp = 1, ρ0=0.1, D0=105

